The logistic map xₙ₊₁ = r xₙ (1 − xₙ) is a model of a population with limited resources. With one parameter and a calculator, students can watch it settle, oscillate and finally behave chaotically. It is the shortest route to the idea of chaos.
What happens as r grows
- 0 < r ≤ 1: the population dies out.
- 1 < r < 3: it settles on a steady value, the fixed point x* = 1 − 1/r.
- r = 3: the fixed point becomes unstable and the values alternate between two levels (a 2-cycle).
- About 3.449: the 2-cycle splits into a 4-cycle, then 8, 16… at ever closer values of r.
- Beyond about 3.5699: chaos. Tiny differences in the starting value grow until the two sequences have nothing in common, yet windows of order appear, such as a 3-cycle near r = 3.83.
The spacing of the period doublings shrinks by a factor close to 4.669, the Feigenbaum constant, the same for a whole family of maps.
Cobweb diagrams
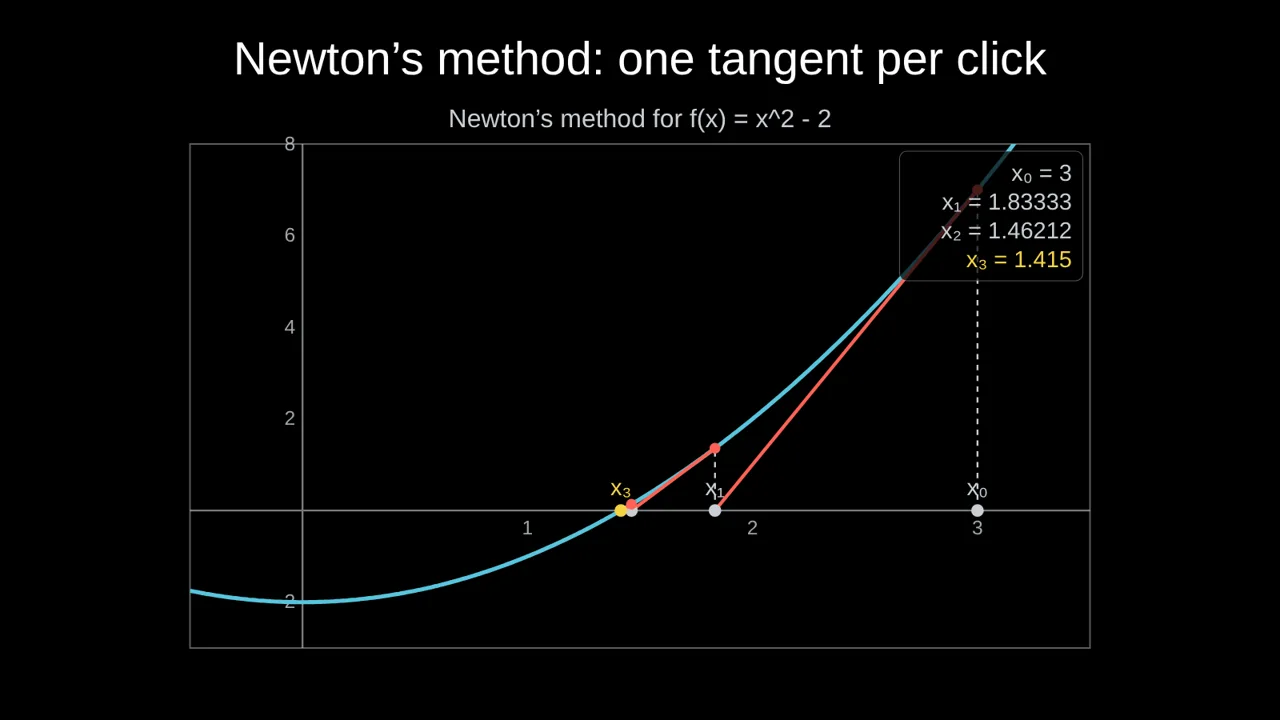
Draw the parabola y = r x (1 − x) and the line y = x. From x₀, go up to the curve, across to the line, up or down to the curve again. The path spirals into a fixed point, settles into a rectangle (a 2-cycle), or wanders everywhere (chaos). Showing one step per click lets the class predict the next move.
The bifurcation diagram
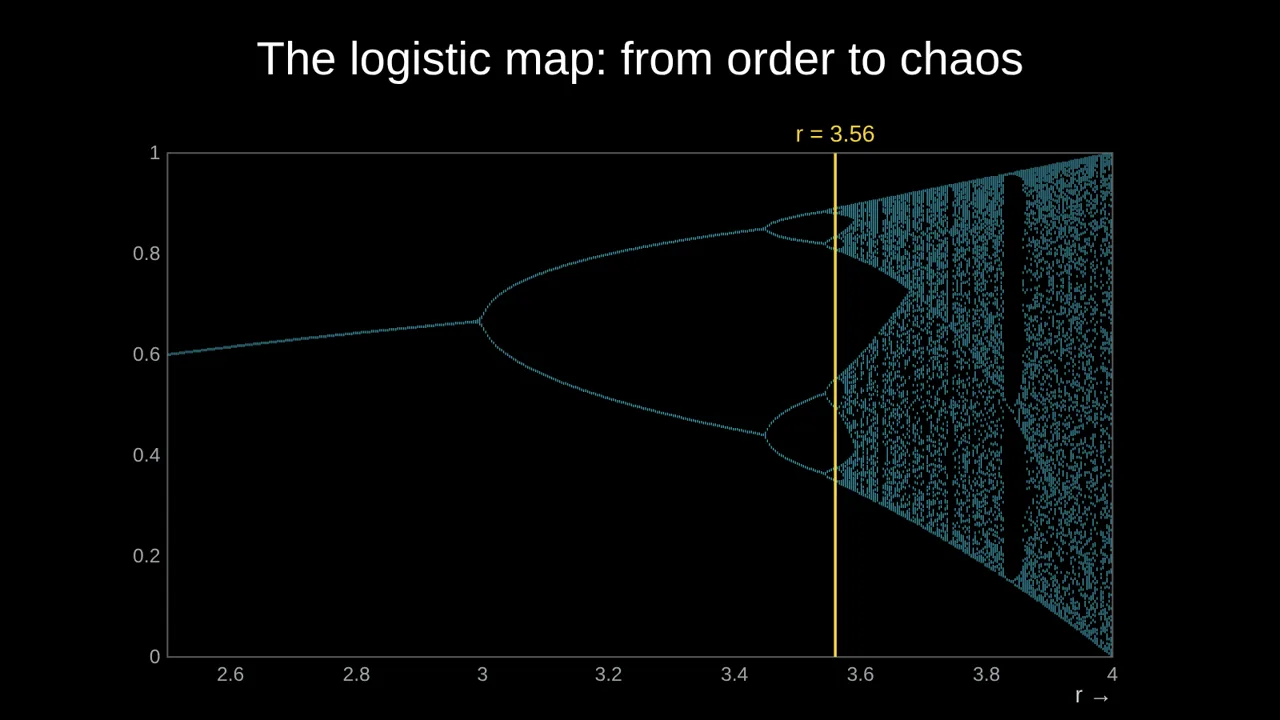
Plot, for each r, the values the sequence keeps returning to. The single branch splits in two at r = 3, then in four, then dissolves into a cloud, with clear windows of order inside it. Moving a line across the diagram while showing the cobweb for the same r links the two pictures.
Build it in Tracé
- Open Plot → Logistic map (chaos).
- Choose Cobweb diagram, Values over time or Bifurcation diagram.
- Animate r on clicks: 2.8, 3.2, 3.5, 3.9 tells the whole story in four clicks.
Questions
Is this beyond school level?
The rule needs only multiplication, and the cobweb only reading a graph. It works from about age 15, and connects to sequences, fixed points and derivatives (the fixed point is stable when |f′(x*)| < 1).
Can I compare two starting values?
Put two Values over time objects with x₀ = 0.2 and 0.2001 side by side at r = 3.9: they agree for a while, then diverge completely.
More: Animated math slides for teachers · How to create math slides, step by step