
Tracé blog
Teaching maths and science with animation
Lesson ideas, the maths behind them, and how to build each slide in a few minutes, without code.
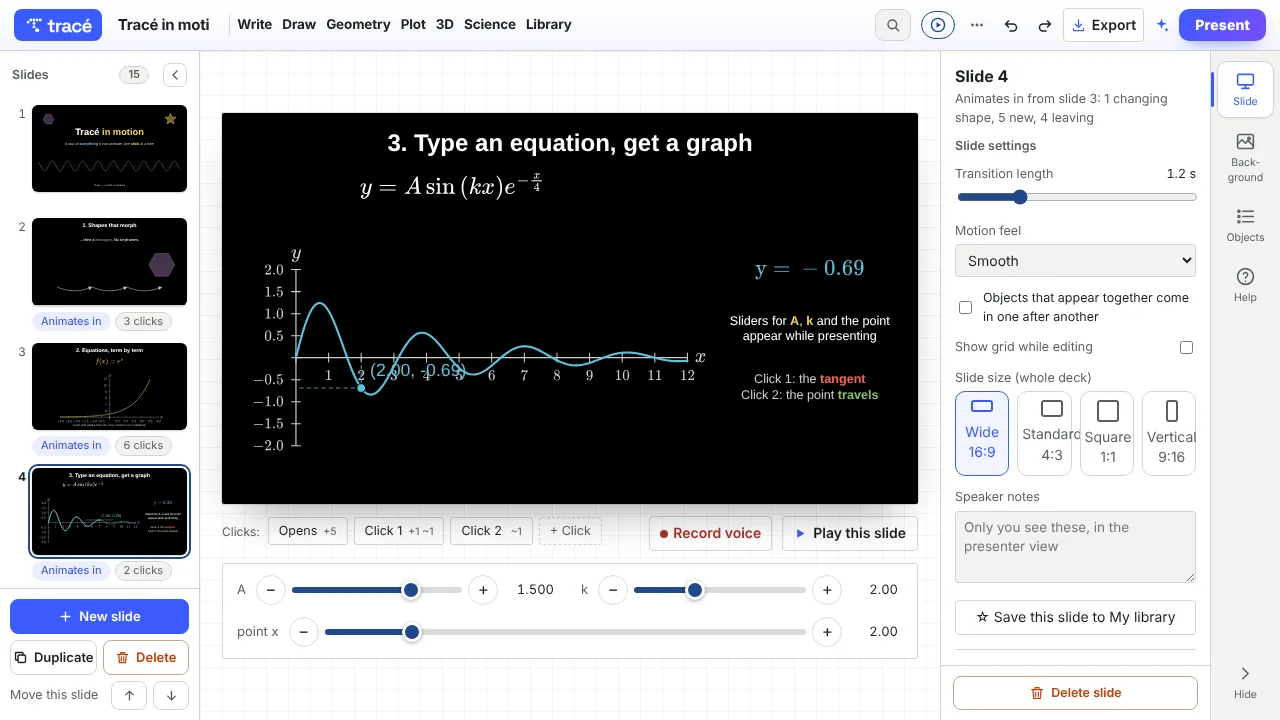 How to Create Math Slides (Step by Step)Create math slides that move: type an equation, get its graph, add a live slider, reveal each step on a click and present. A free, step-by-step guide.
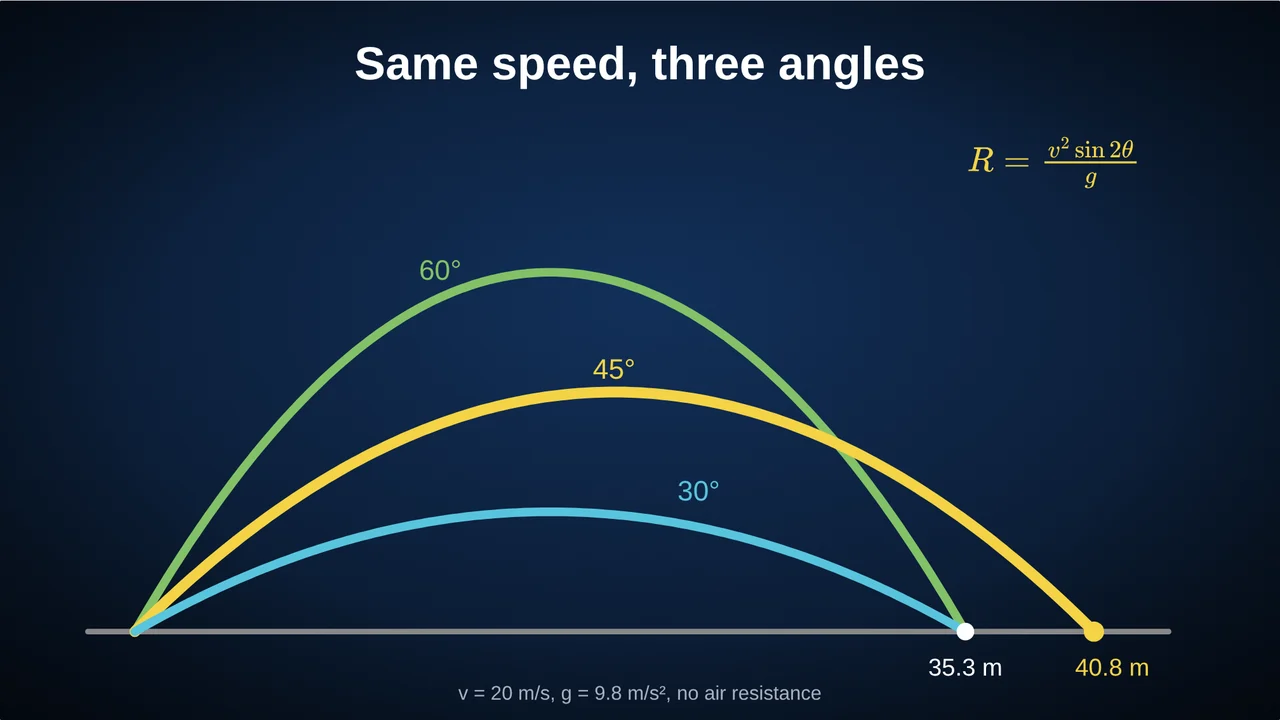 Why 45° Is the Best Launch Angle (and When It Isn’t)The proof that 45° gives the longest throw, why 30° and 60° land in the same place, and why real throws use less: launch height and air resistance.
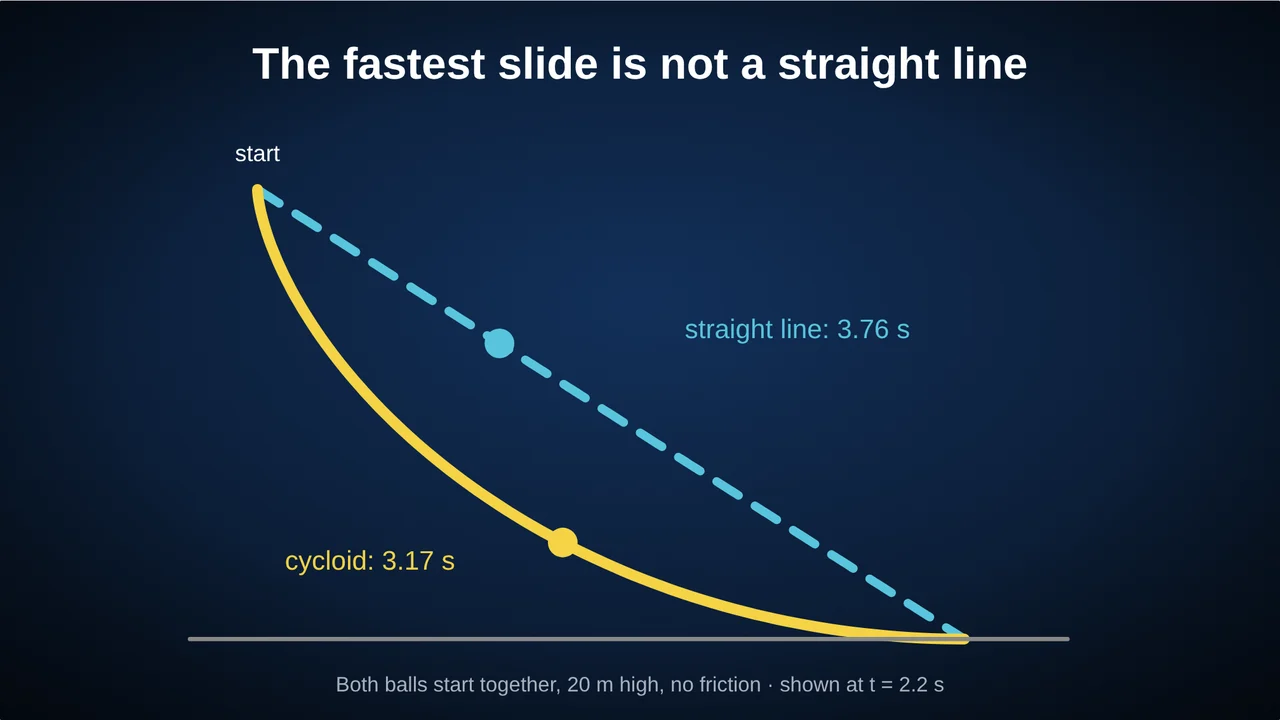 The Brachistochrone: Why the Fastest Path Is a CurveWhy a ball on a cycloid beats one on a straight ramp (3.17 s against 3.76 s for a 20 m drop), the 1696 challenge behind it, and how to animate the race.
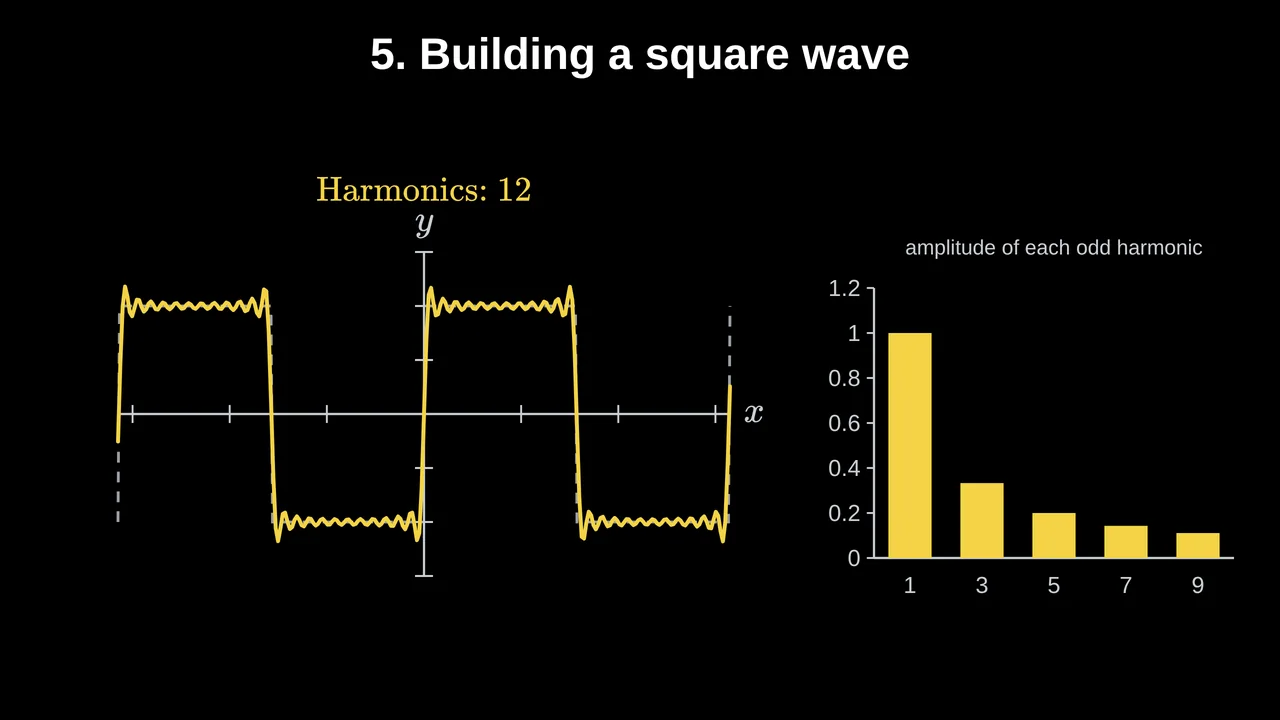 Fourier Series: How Sine Waves Build a Square WaveAdd sin x, sin 3x / 3, sin 5x / 5… and a square wave appears. The formula, why only odd harmonics, the 9% Gibbs overshoot, and a click-by-click slide.
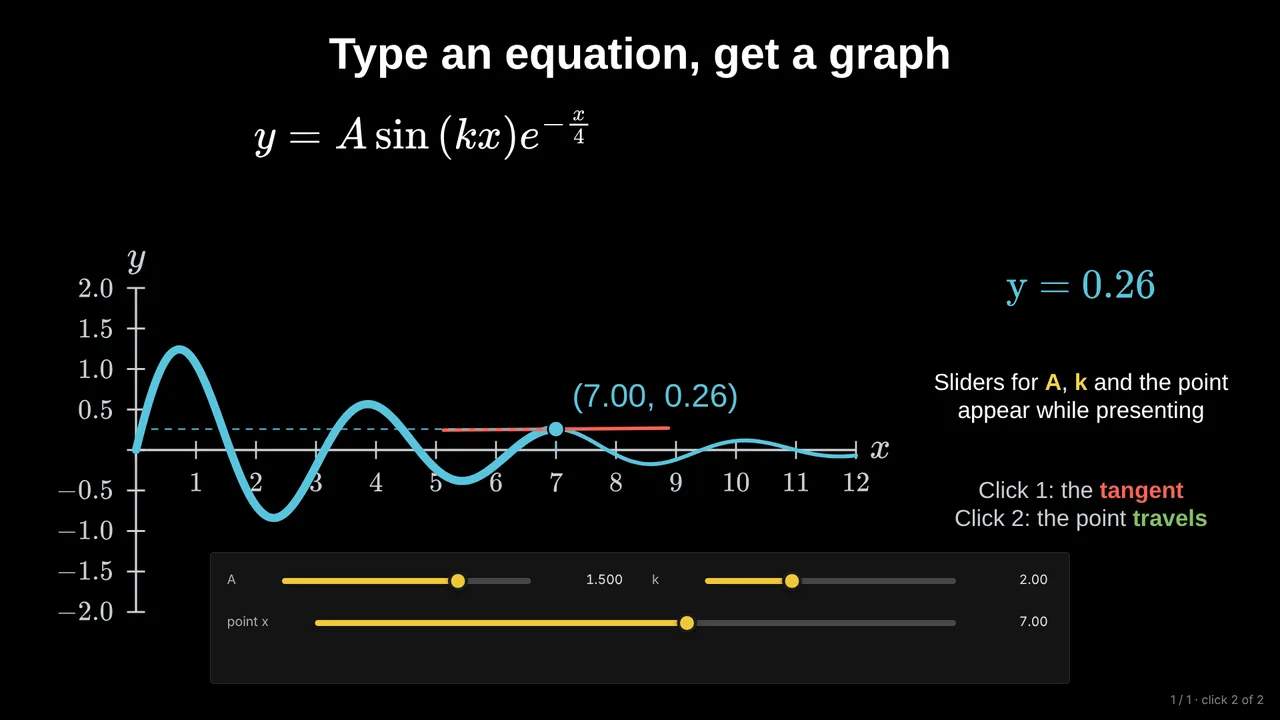 Interactive Maths Slides: Beyond PowerPoint for TeachersWhat makes a maths slide interactive, what PowerPoint, GeoGebra and Desmos each do well, and how to build click-by-click slides with live sliders.
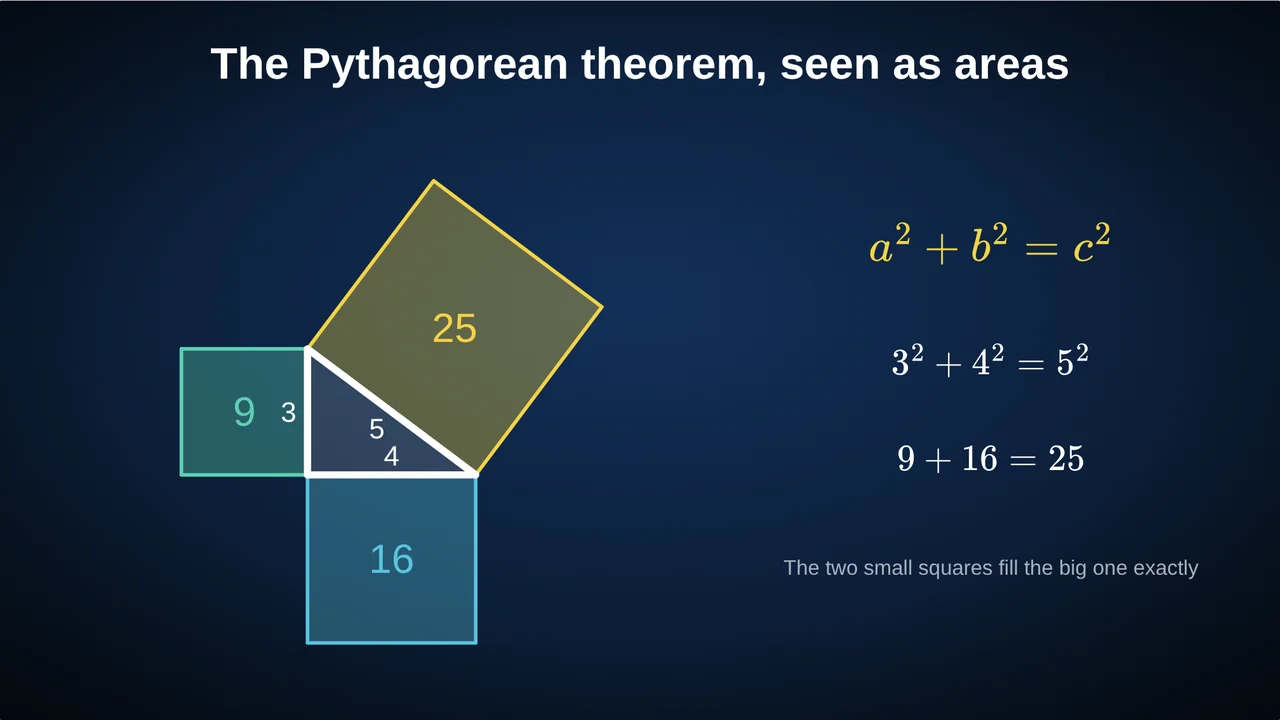 Pythagorean Theorem Lesson: A Visual Proof in 5 ClicksA ready-to-teach Pythagorean theorem lesson: the areas picture, a proof students can follow, common mistakes, check questions, and how to animate it.
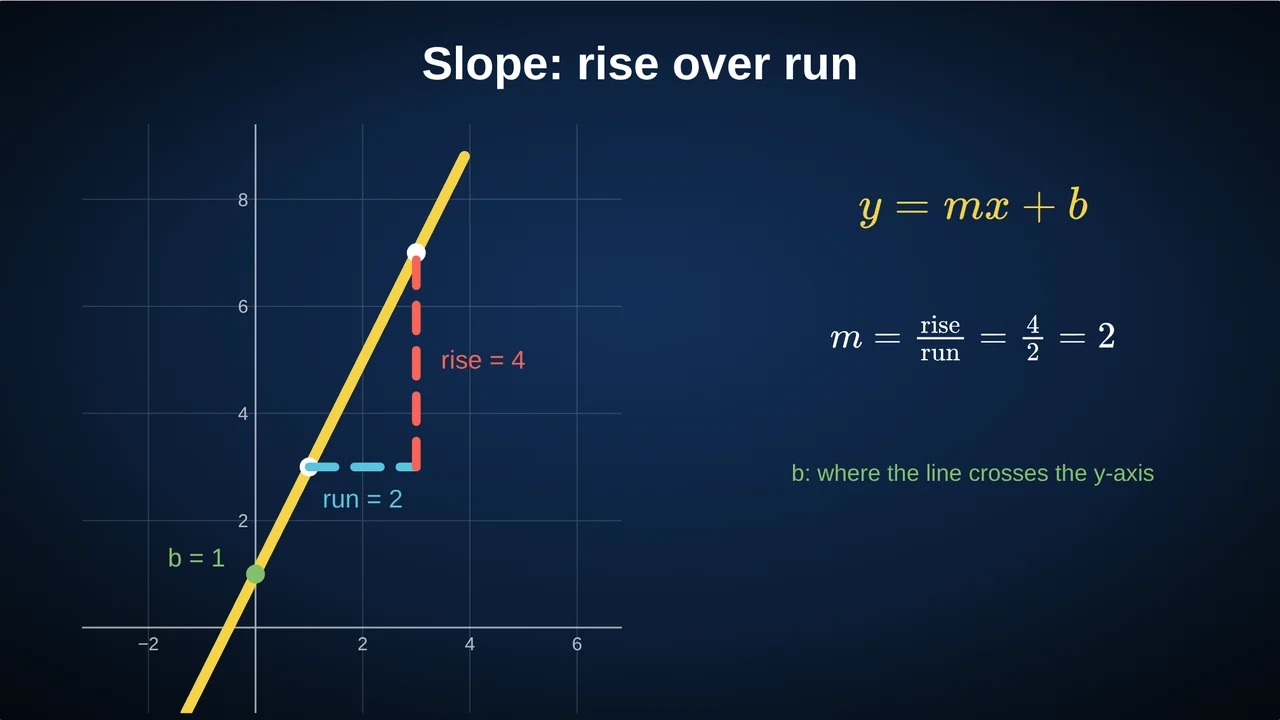 Teaching Slope and y = mx + b: An Animated Lesson PlanA slope lesson students can see: rise over run, what m and b do to a line, the usual mistakes, check questions, and live sliders for m and b.
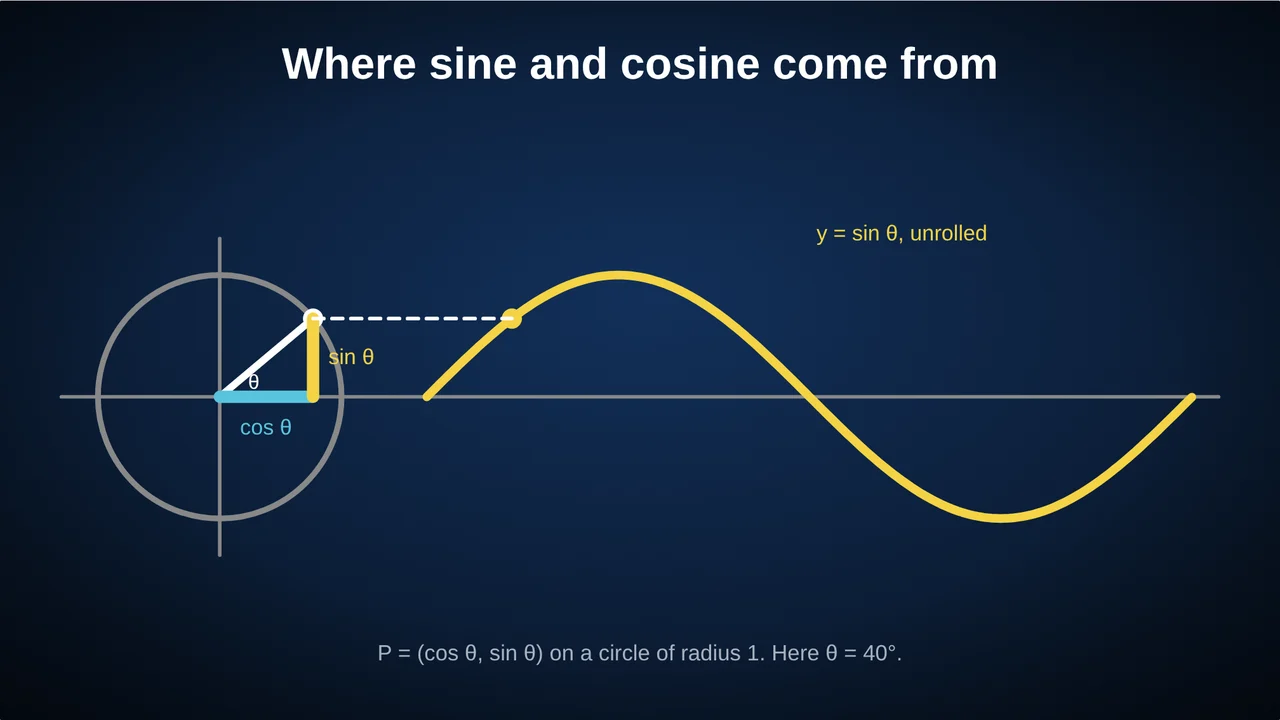 The Unit Circle Lesson: Where Sine and Cosine Come FromA unit circle lesson plan: sine and cosine as coordinates, special angles, signs in each quadrant, the sine wave unrolled, common mistakes and checks.
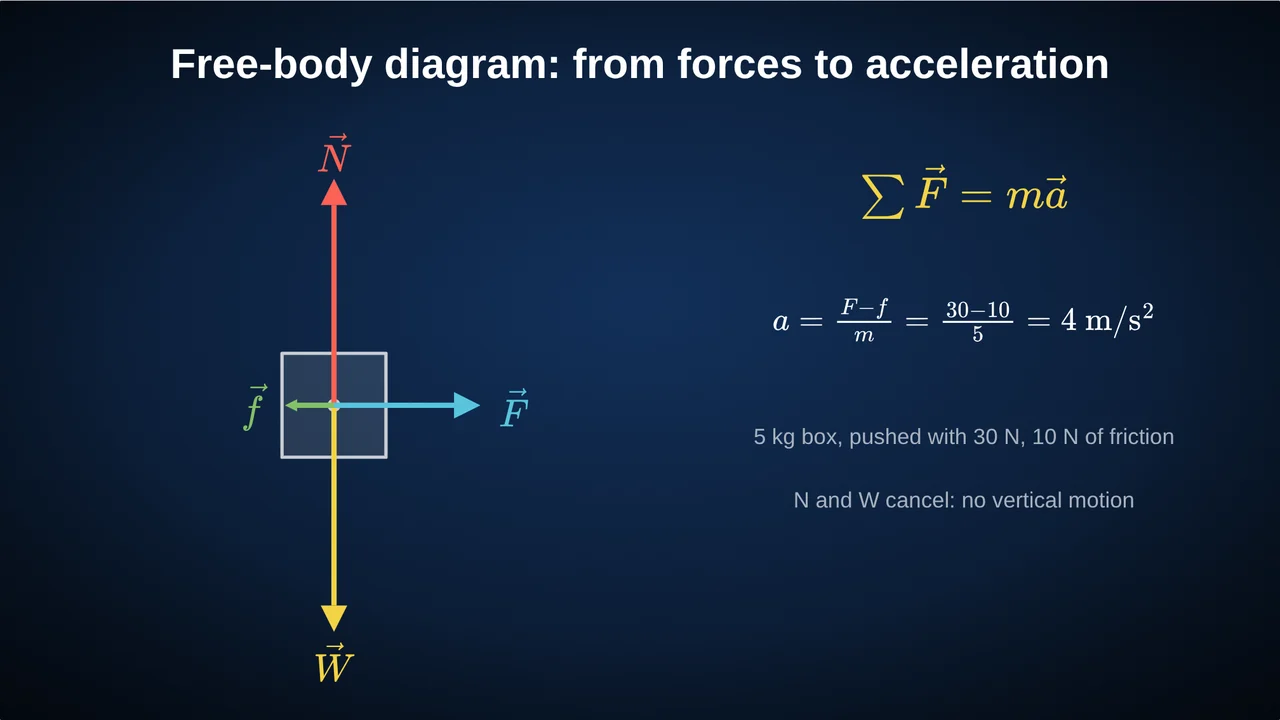 Free-Body Diagrams and Newton’s Second Law: A Lesson PlanHow to teach free-body diagrams step by step, a worked example (30 N push, 10 N friction, 5 kg: a = 4 m/s²), the classic mistakes and check questions.
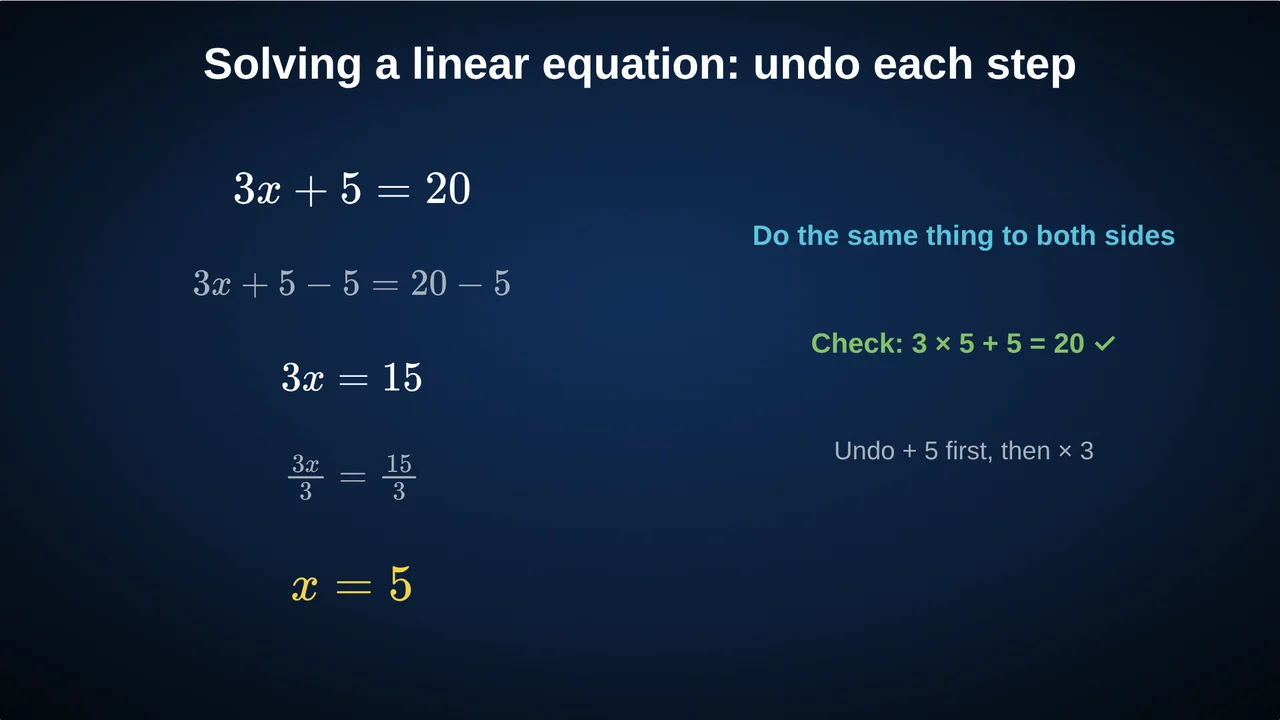 Solving Linear Equations: A Step-by-Step Lesson PlanTeach solving linear equations as undoing steps: a balance-based lesson, worked examples, the classic sign mistakes, check questions and animated steps.
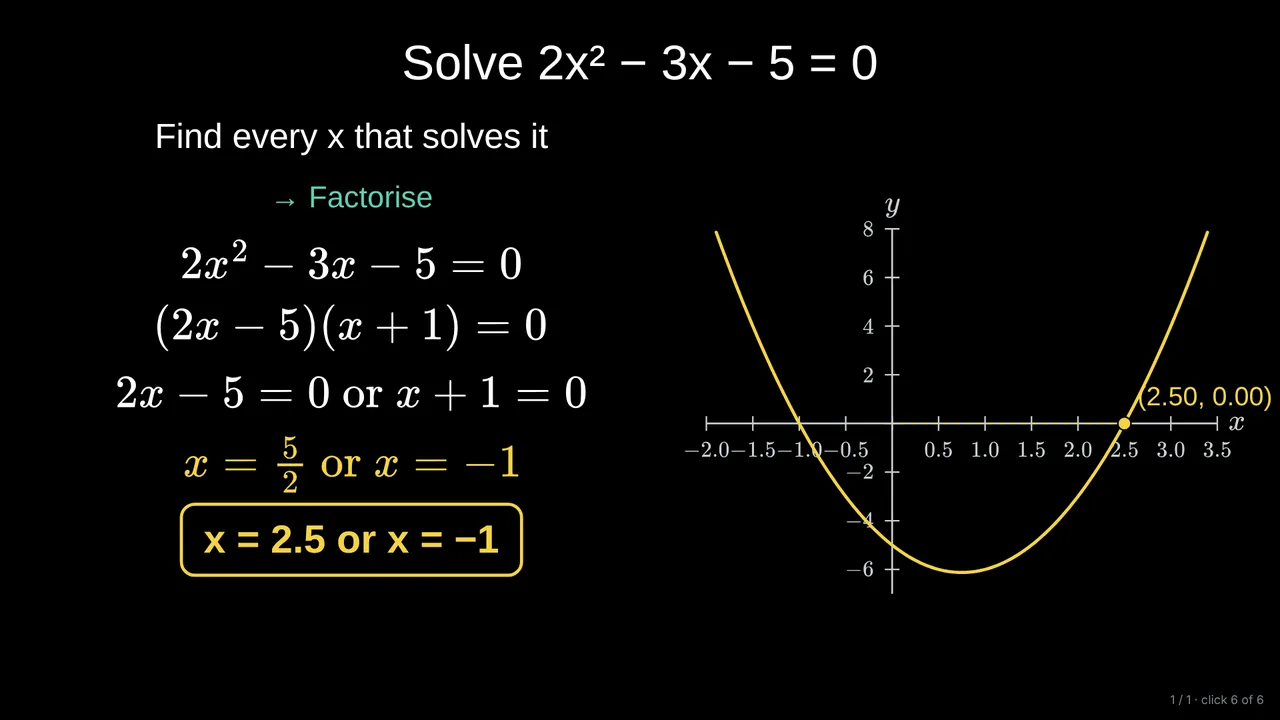 Solving Quadratic Equations by Factoring: Lesson PlanSolve quadratic equations by factoring: the zero-product rule, the product–sum method, a worked example, common mistakes and checks, with the graph alongside.
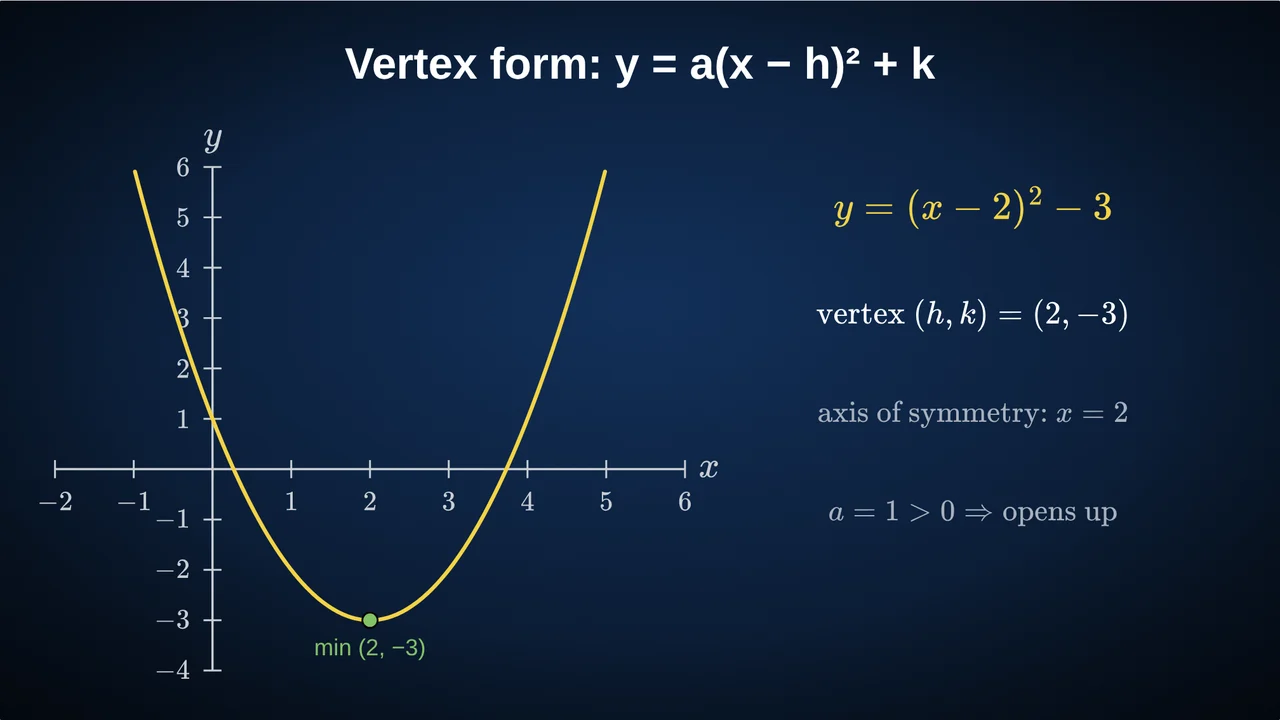 Graphing Quadratic Functions in Vertex Form: Lesson PlanTeach vertex form y = a(x − h)² + k: what a, h and k do to a parabola, completing the square, the sign trap with h, and live sliders to explore it.
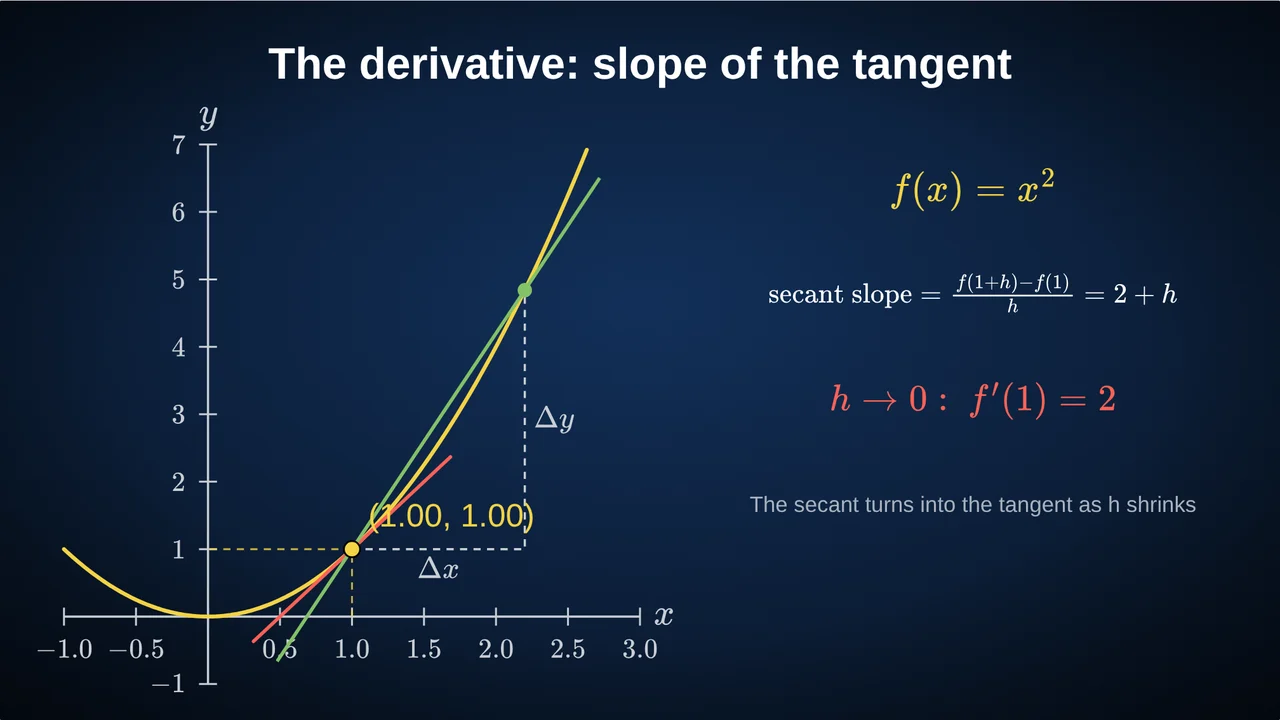 The Derivative as the Slope of a Tangent: Lesson PlanIntroduce the derivative as the slope of the tangent line: secants that shrink, the limit (f(x+h) − f(x))/h, a worked example with x², mistakes and checks.
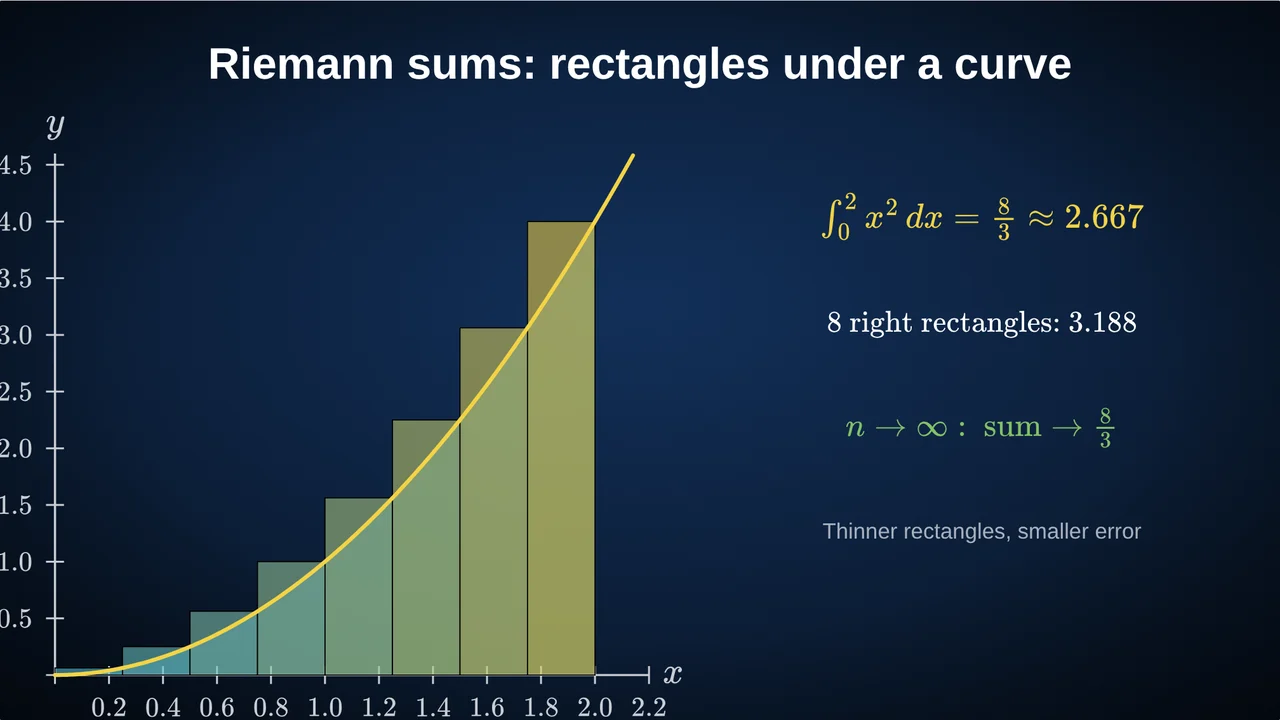 Riemann Sums: Teaching the Area Under a CurveA Riemann sums lesson: left, right and midpoint rectangles under y = x², exact numbers for 8 rectangles, how the error shrinks, mistakes and checks.
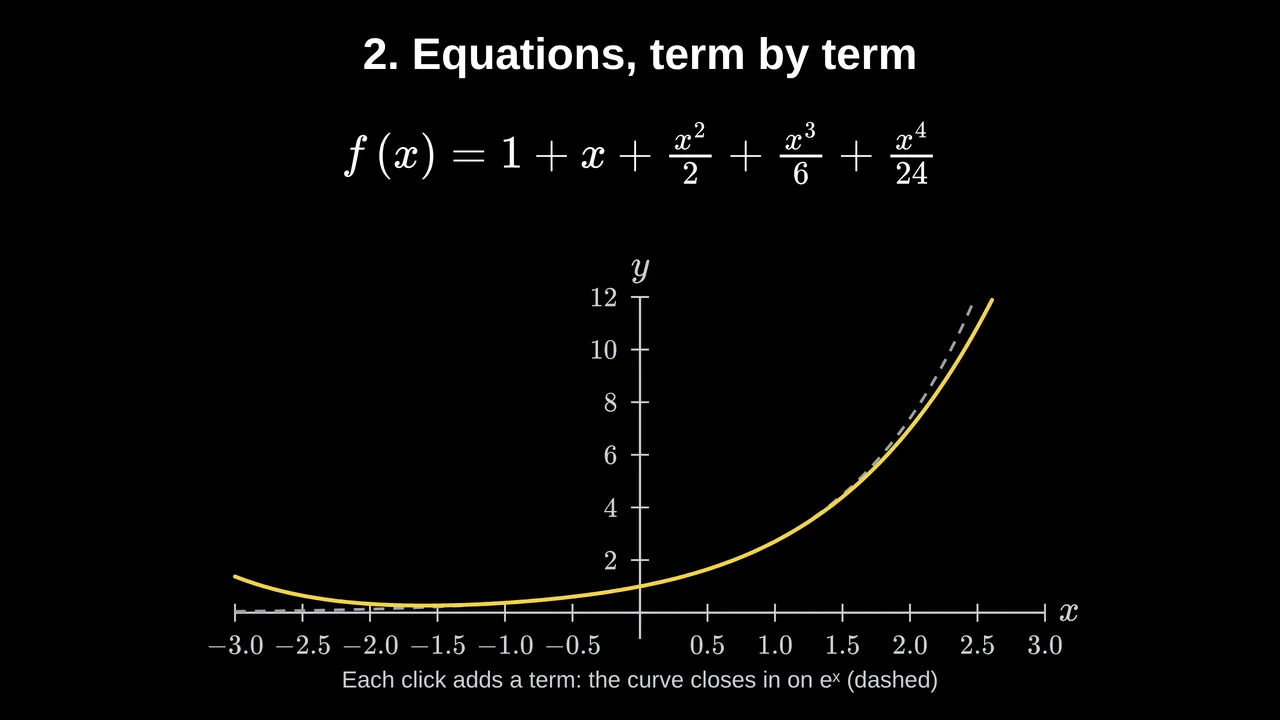 Taylor Series: Approximating Functions with PolynomialsHow Taylor series build eˣ and sin x from polynomials term by term, how accurate a few terms are, the small-angle approximation, and a click-by-click slide.
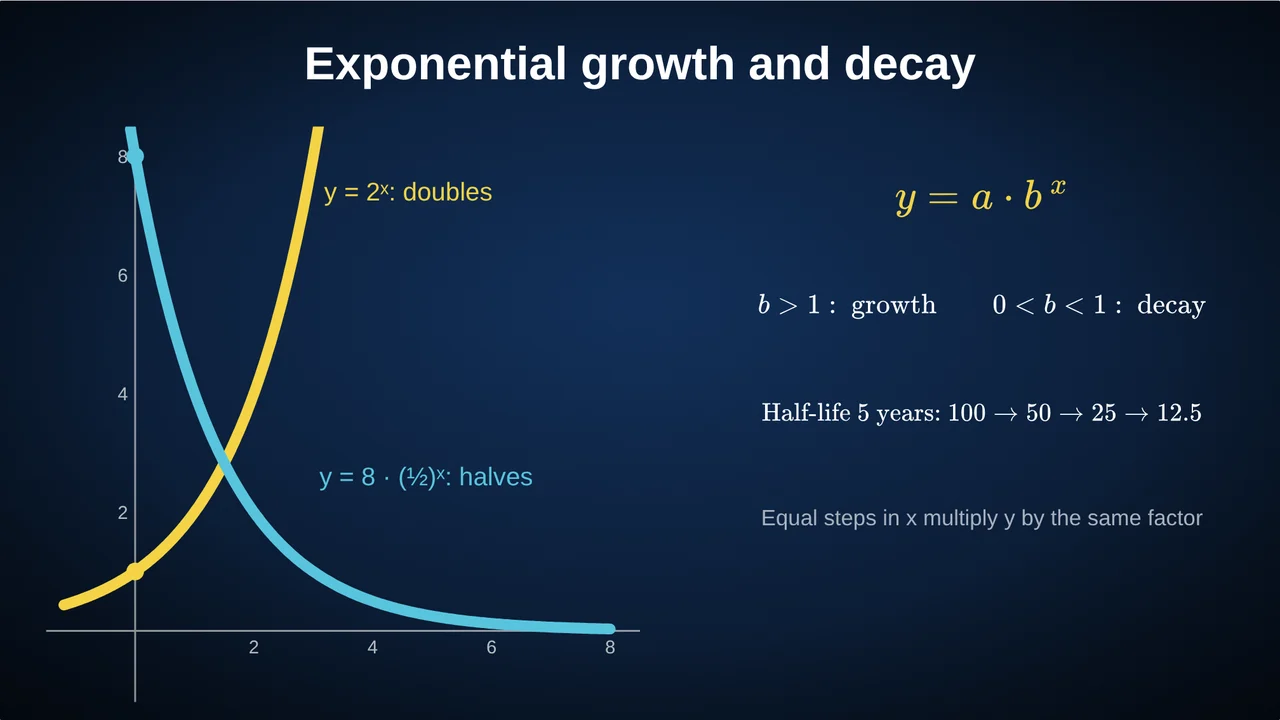 Exponential Growth and Decay: A Lesson PlanTeach exponential growth and decay with y = a·bˣ: doubling, half-life, compound interest, why exponential beats x², common mistakes and check questions.
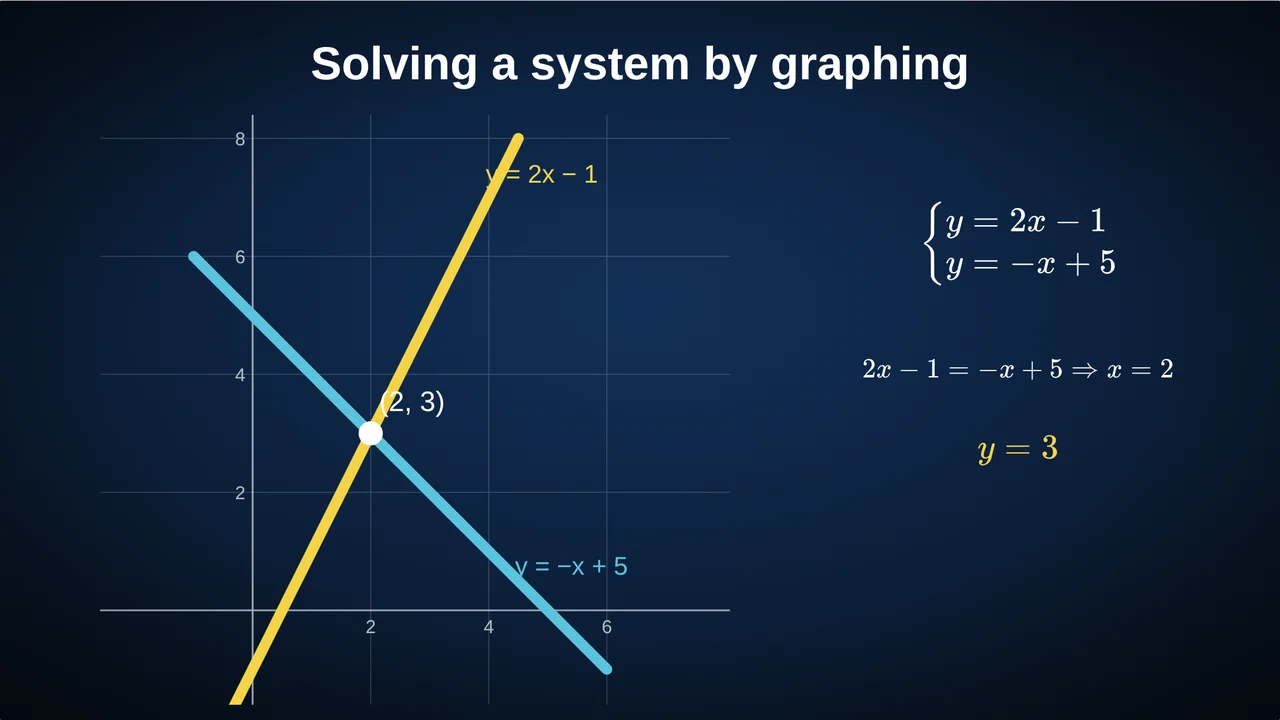 Solving Systems of Equations by Graphing: Lesson PlanTeach systems of linear equations by graphing: the intersection as the solution, one, none or infinitely many solutions, substitution as a check, and mistakes.
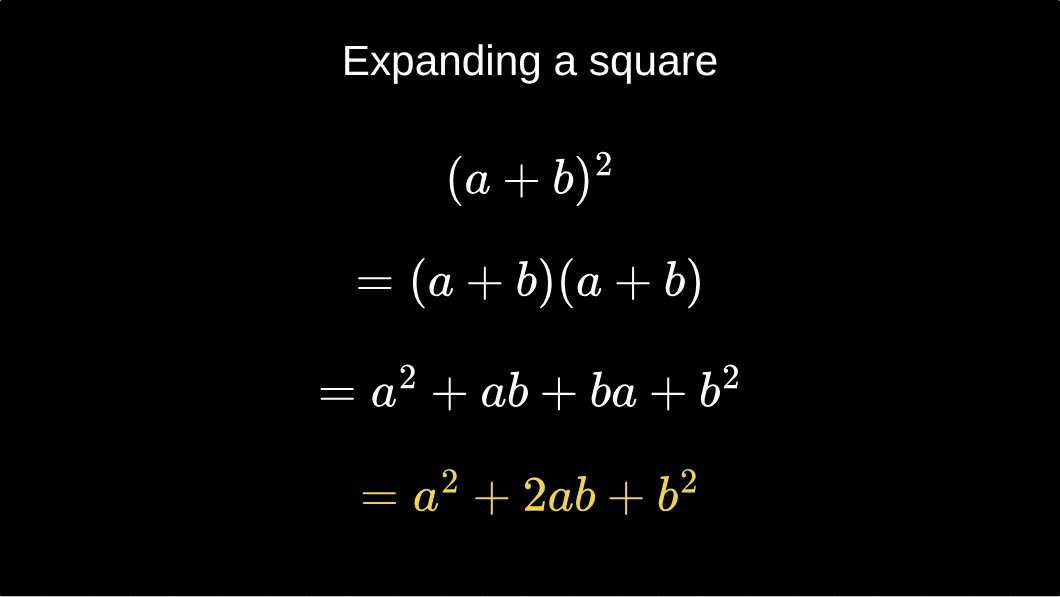 Expanding Brackets and (a + b)²: An Area Model LessonTeach expanding brackets with the area model: why (a + b)² = a² + 2ab + b², not a² + b², the difference of two squares, mistakes and check questions.
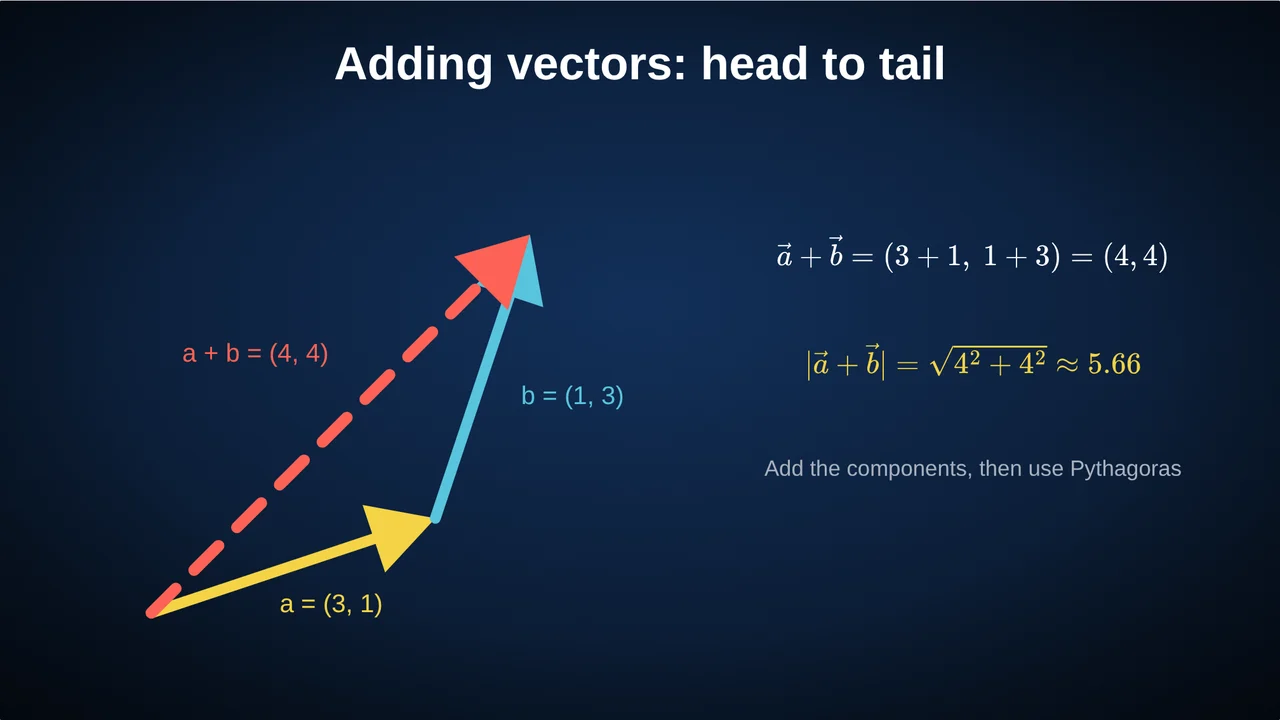 Adding Vectors Head to Tail: A Lesson PlanTeach vector addition: head-to-tail drawings, adding components, the magnitude with Pythagoras, a river-crossing example, common mistakes and checks.
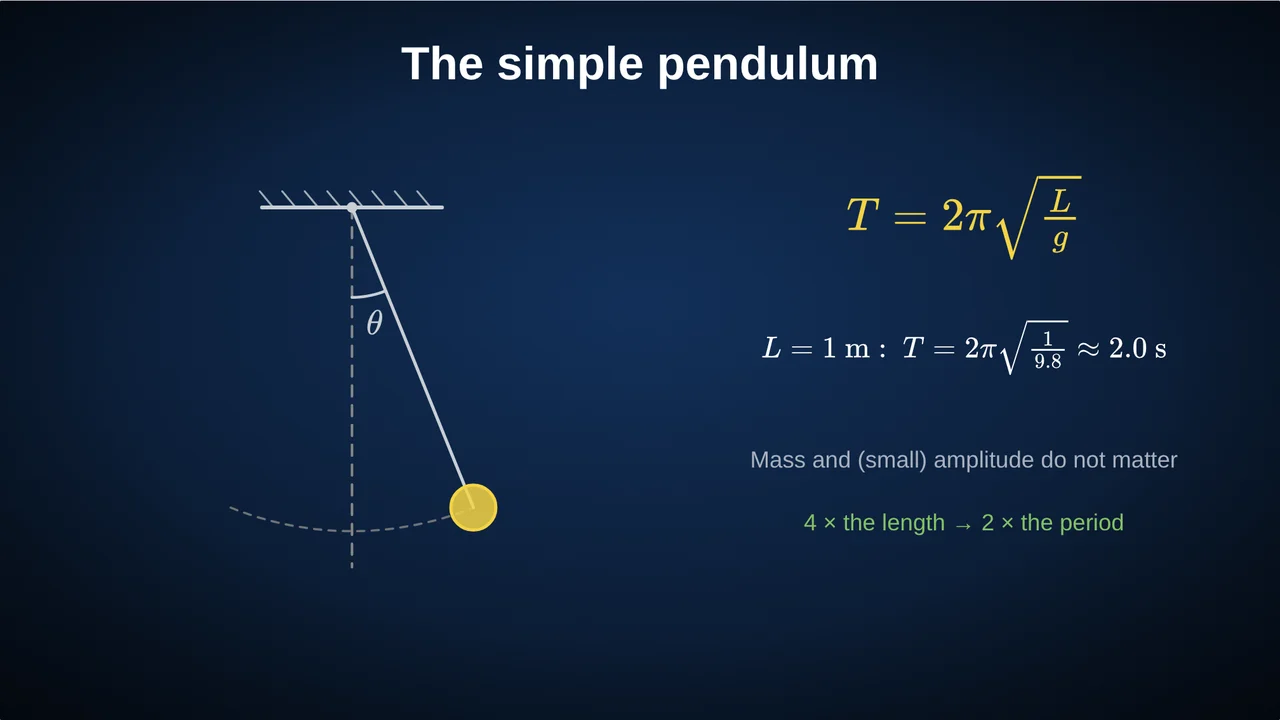 The Simple Pendulum Period: T = 2π√(L/g) Lesson PlanTeach the simple pendulum period formula T = 2π√(L/g): what changes the period and what does not, the small-angle limit, worked examples and checks.
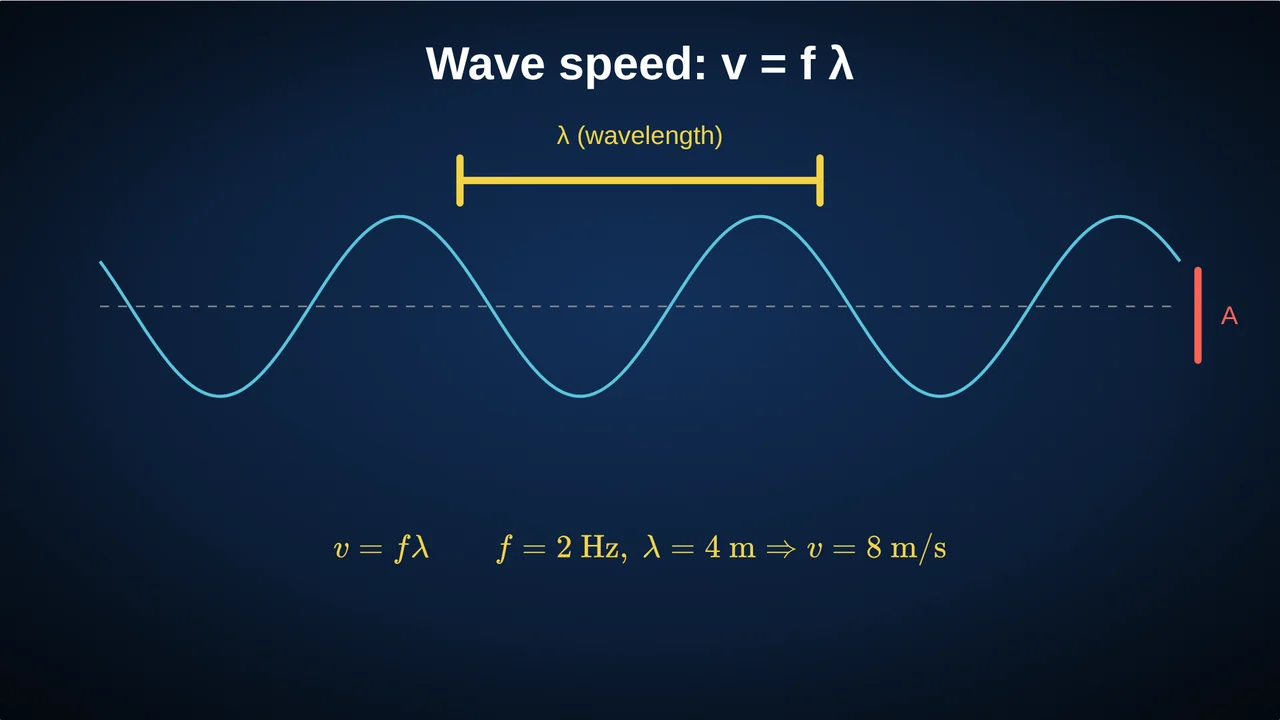 Wave Speed, Frequency and Wavelength: v = fλ LessonTeach the wave equation v = fλ: wavelength, frequency, period and amplitude on one animated wave, examples with sound and light, mistakes and checks.
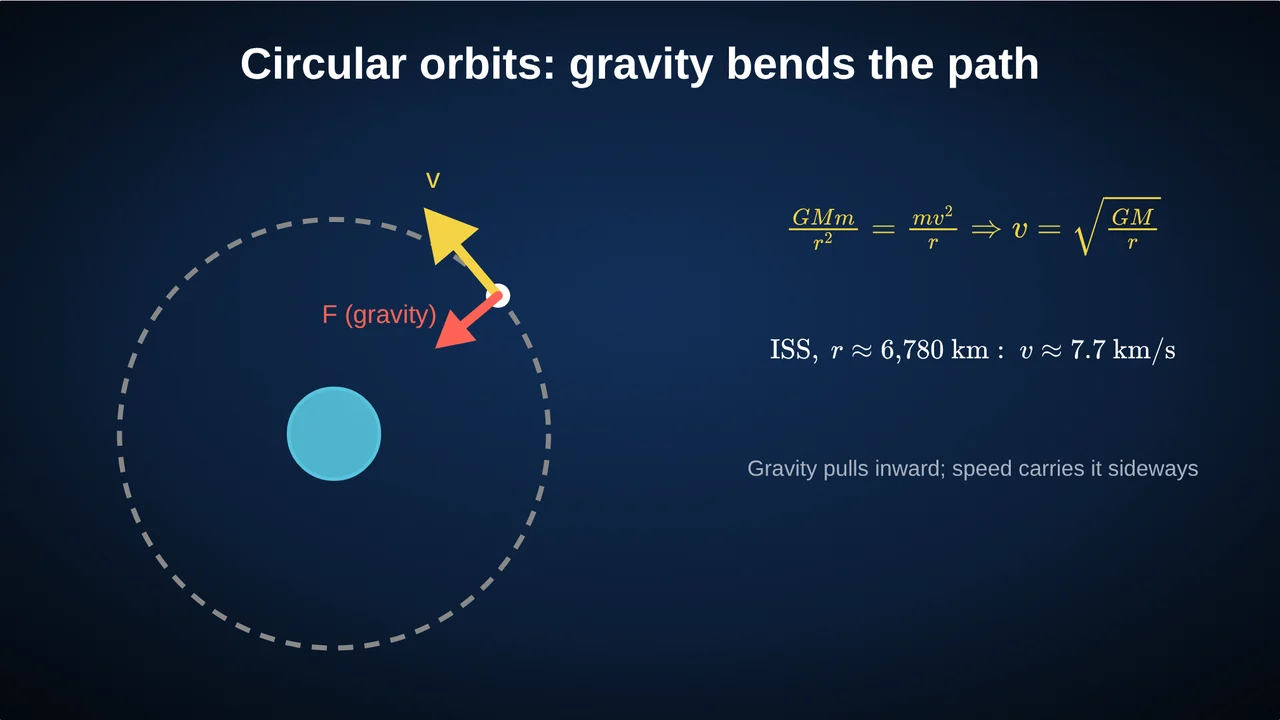 Circular Orbits and Gravity: Why Satellites Don’t FallA lesson on circular orbits: gravity as the centripetal force, orbital speed v = √(GM/r), the ISS at 7.7 km/s and 92 minutes, geostationary orbit, and mistakes.
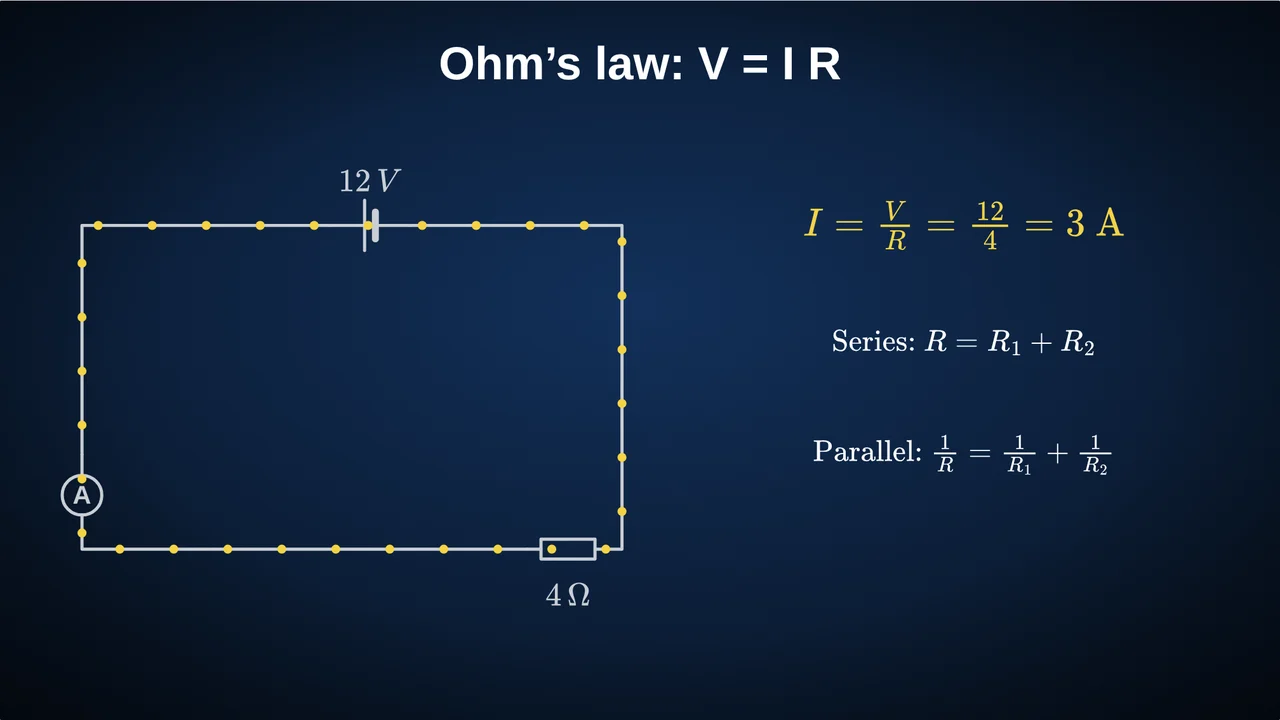 Ohm’s Law and Simple Circuits: A Lesson PlanTeach Ohm’s law V = IR with a live circuit: current, voltage, resistance, series and parallel resistors, power, the classic misconceptions and checks.
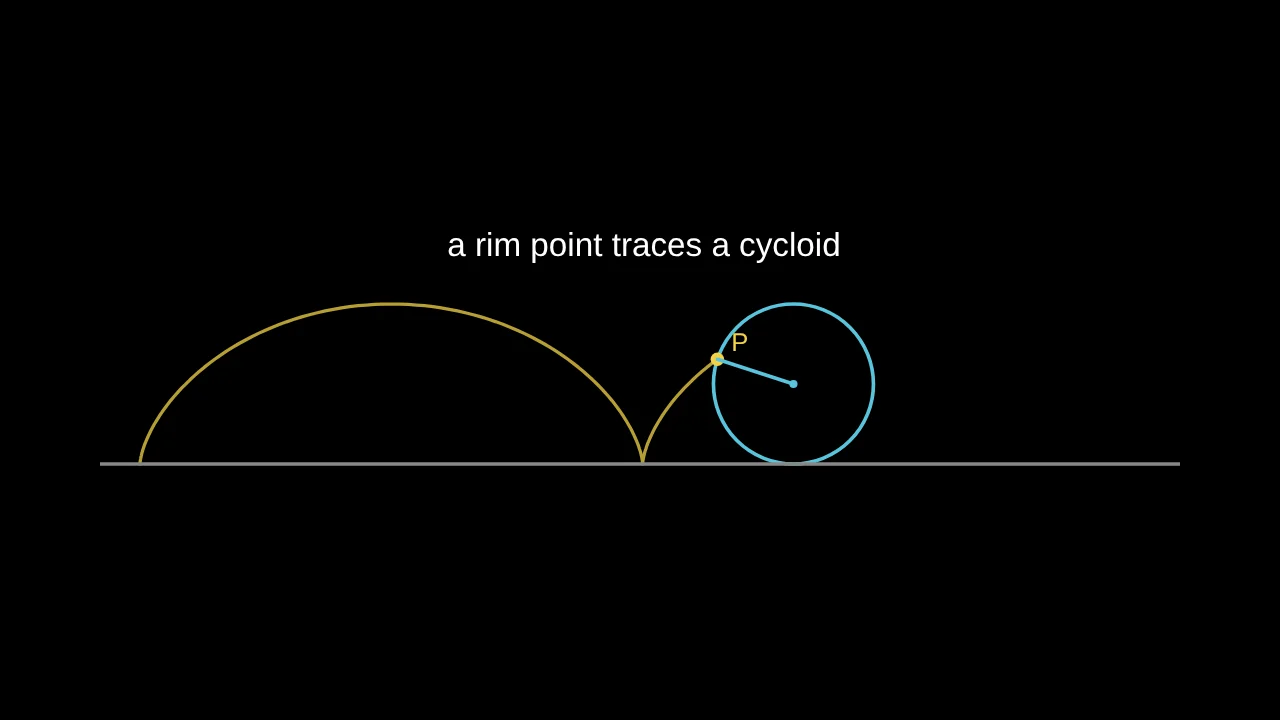 Custom Maths Animations in a Few Lines, No CodePoints, vectors and curves that move with time: write a rolling wheel or a sliding ladder in six lines of calculator maths, or let the AI write it.
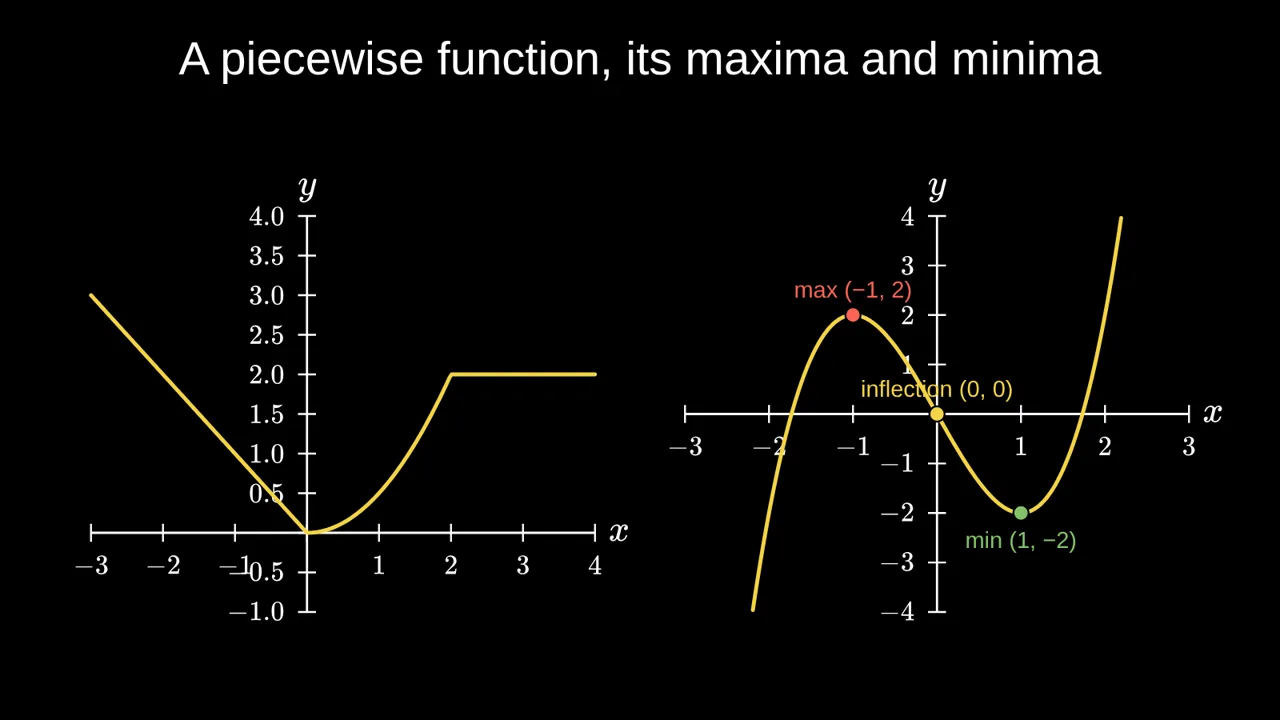 How to Animate Maths for Teaching, Without CodeA practical guide to animated maths slides: what to animate, how to reveal ideas one click at a time, and how to build it without Python or Manim.
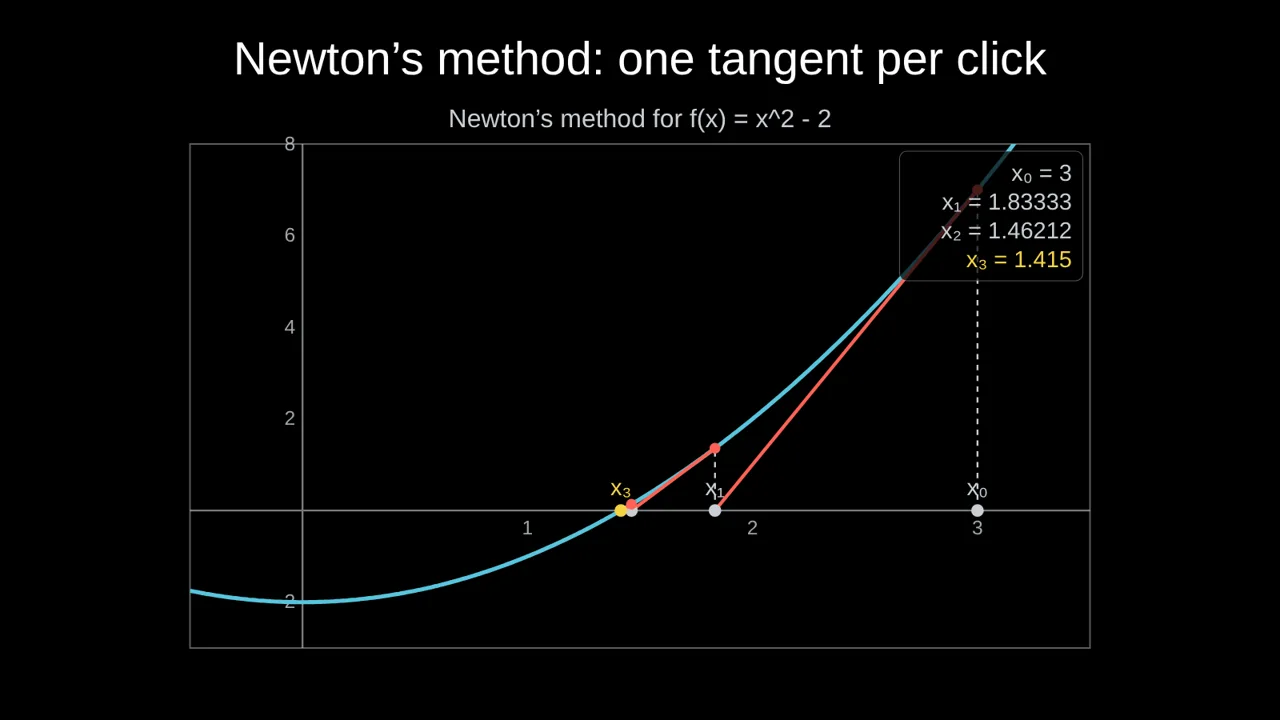 Newton's Method, Animated: One Tangent per ClickTeach Newton's method visually: follow each tangent down to the x-axis, compare it with bisection, and see why it converges so fast, or fails.
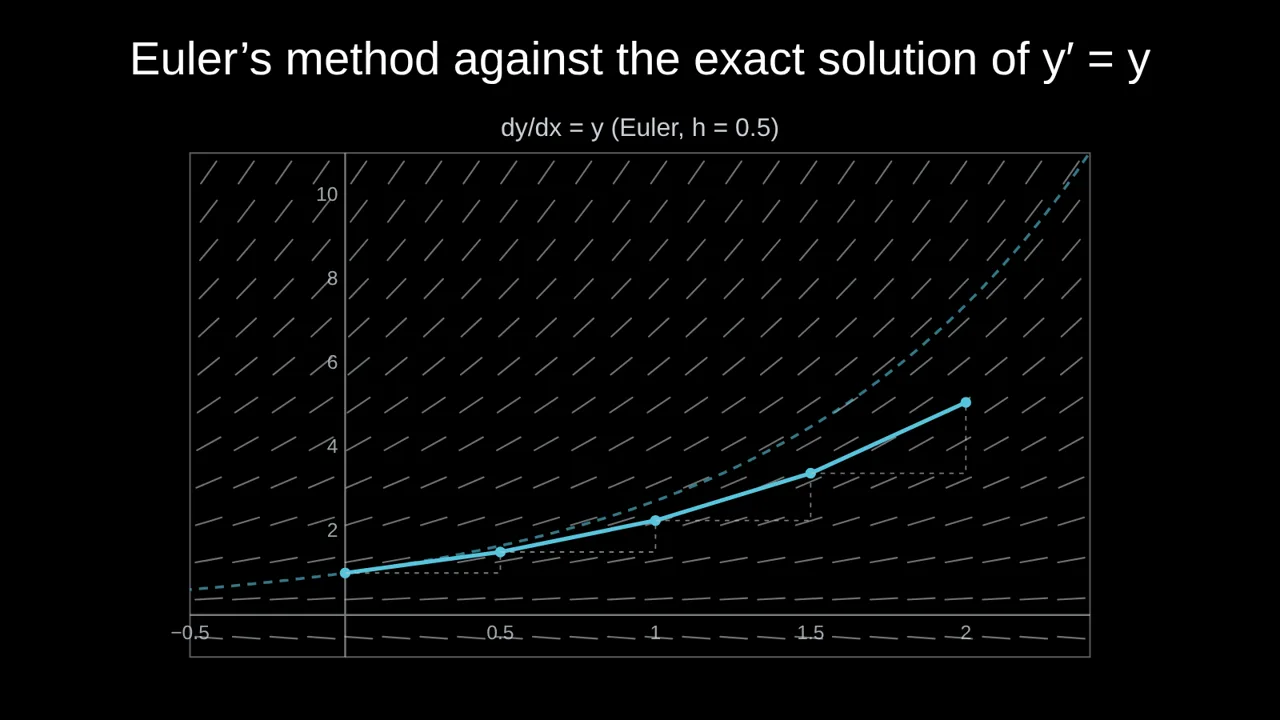 Euler's Method and Direction Fields, VisuallyA visual lesson on differential equations: draw the direction field, follow solution curves, then watch Euler’s method step away from the exact solution.
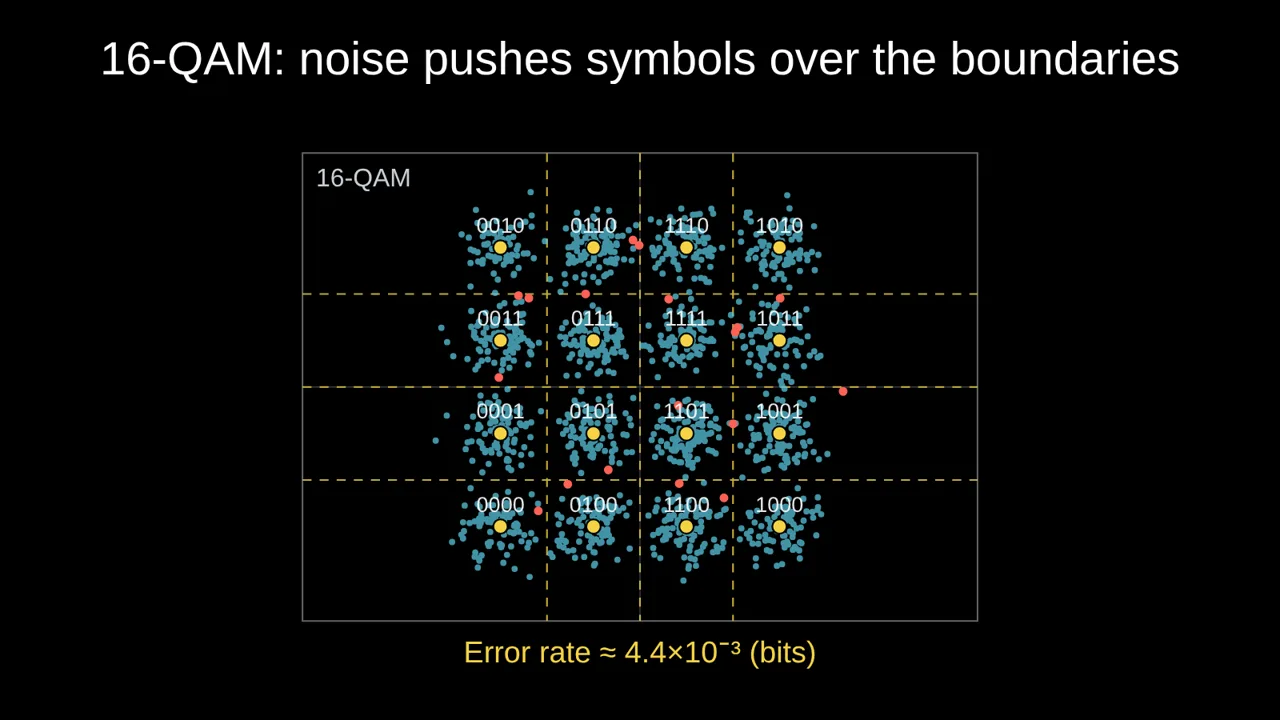 QAM Constellation Diagrams, Explained (BPSK to 256-QAM)What a constellation diagram shows, why 256-QAM needs a cleaner channel than QPSK, Gray coding, noise and phase errors, with animated examples.
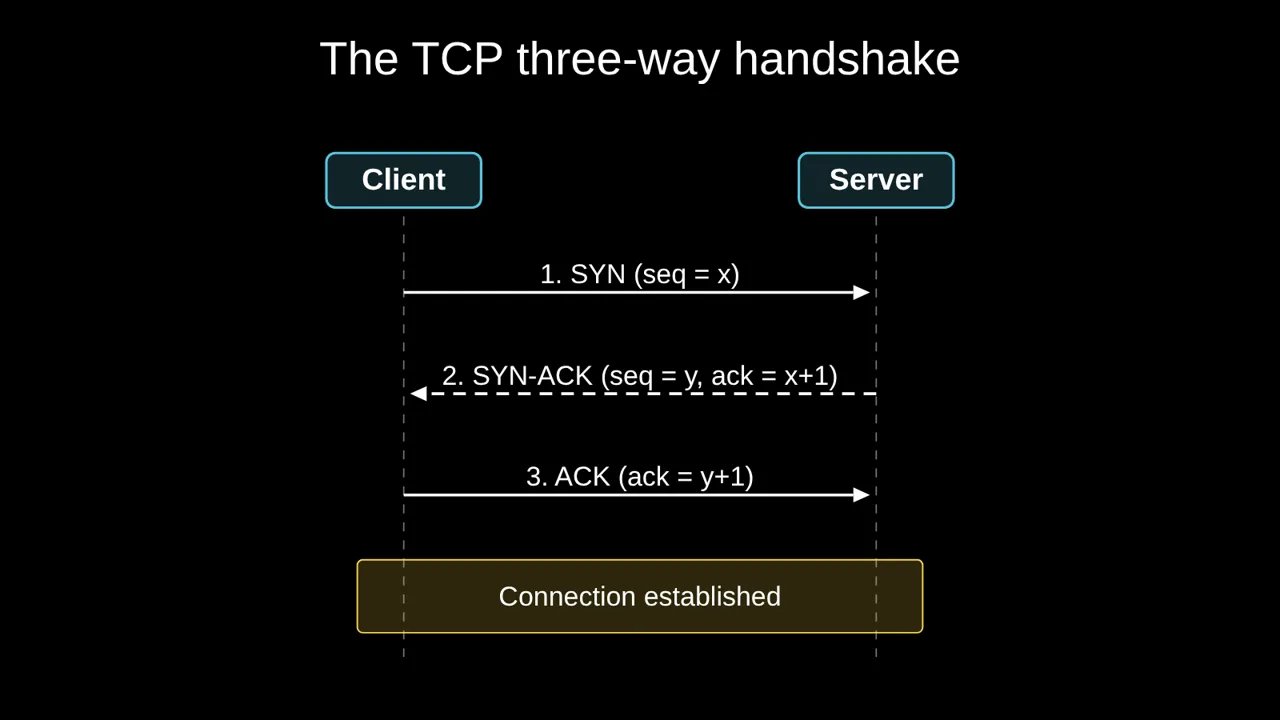 How to Explain the TCP Three-Way HandshakeTeach the TCP handshake with a sequence diagram that plays one message per click: SYN, SYN-ACK, ACK, sequence numbers, and what happens when a packet is lost.
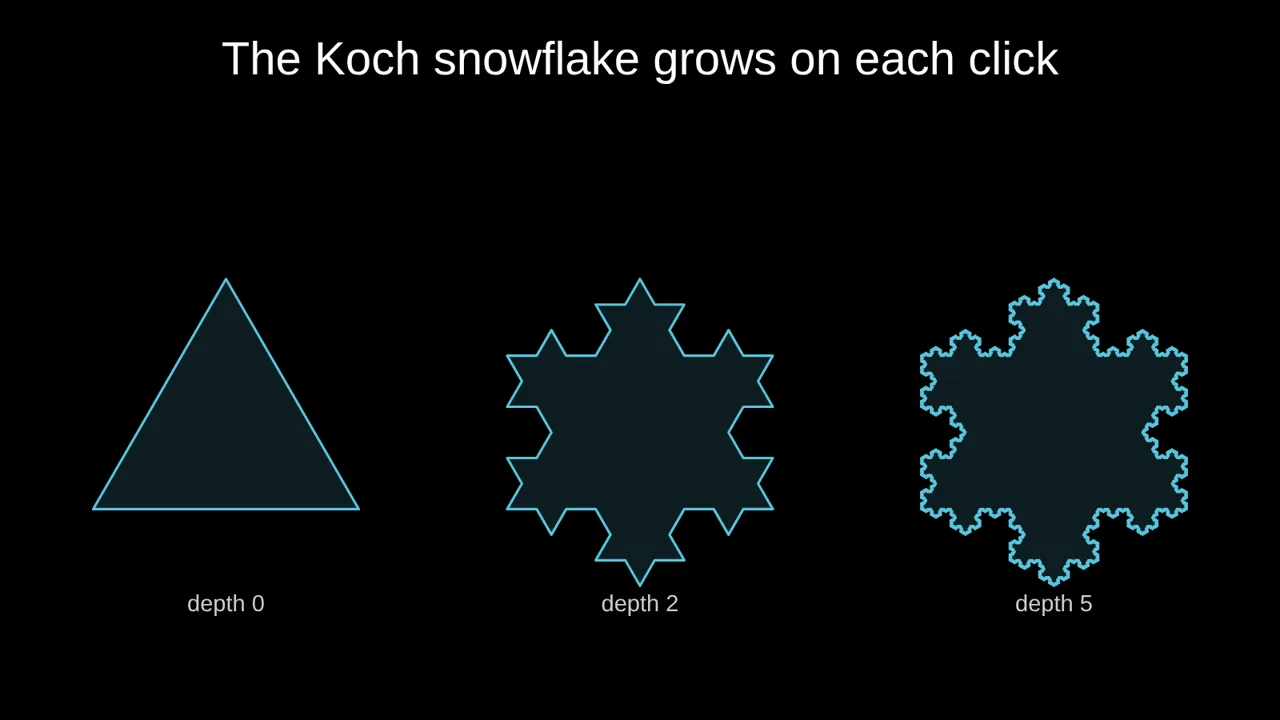 Fractals in the Classroom: Koch, Sierpinski, MandelbrotThree fractals that hook a class: the Koch snowflake step by step, the Sierpinski triangle and the Mandelbrot set, with the maths behind each.
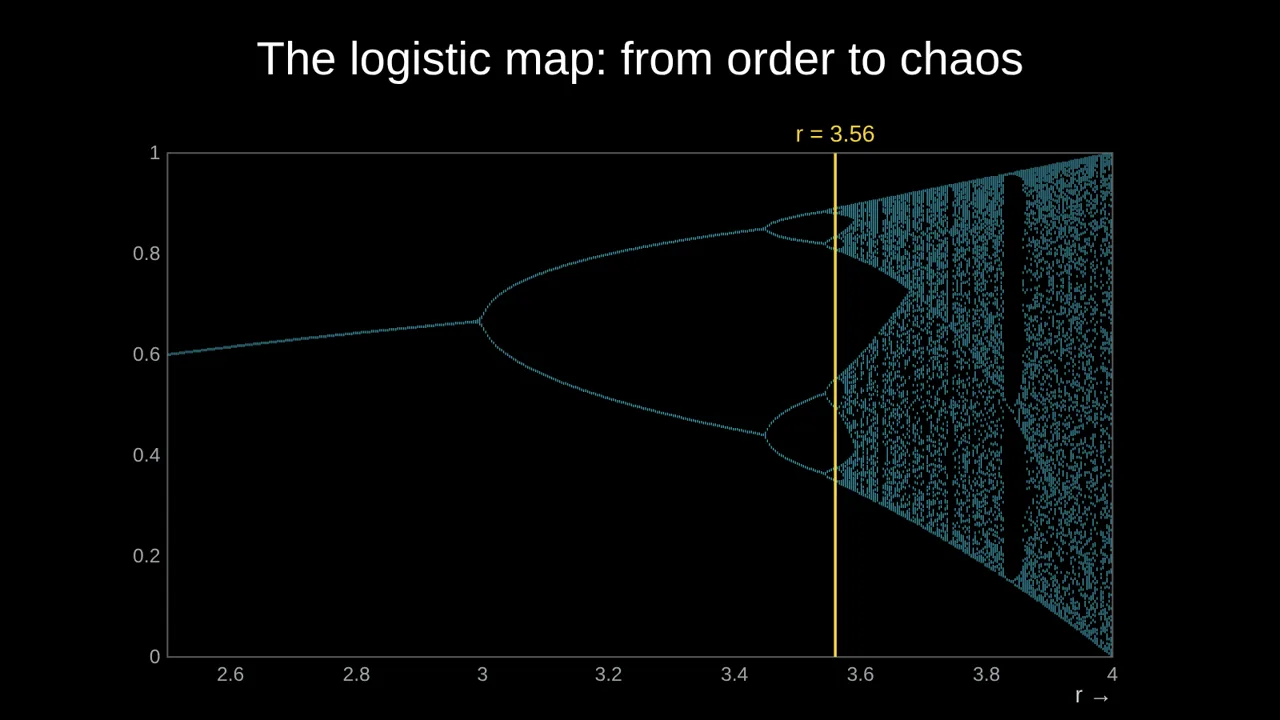 The Logistic Map: Teaching the Road to ChaosOne simple rule, x → r x (1 − x), goes from a steady state to cycles to chaos as r grows. Cobweb diagrams and the bifurcation diagram, explained.