Fractals are a rare topic where a picture comes first and the questions follow by themselves: how long is that edge? How much area does it enclose? Built one level per click, they are also a natural lesson on sequences and limits.
The Koch snowflake: infinite perimeter, finite area
Start with an equilateral triangle. At each step, replace the middle third of every side with two sides of a smaller triangle pointing outwards.
- Each step multiplies the number of sides by 4 and divides their length by 3, so the perimeter is multiplied by 4/3. After n steps it is (4/3)n times the original: it grows without limit.
- The area increases by smaller and smaller amounts and converges to 8/5 of the original triangle.
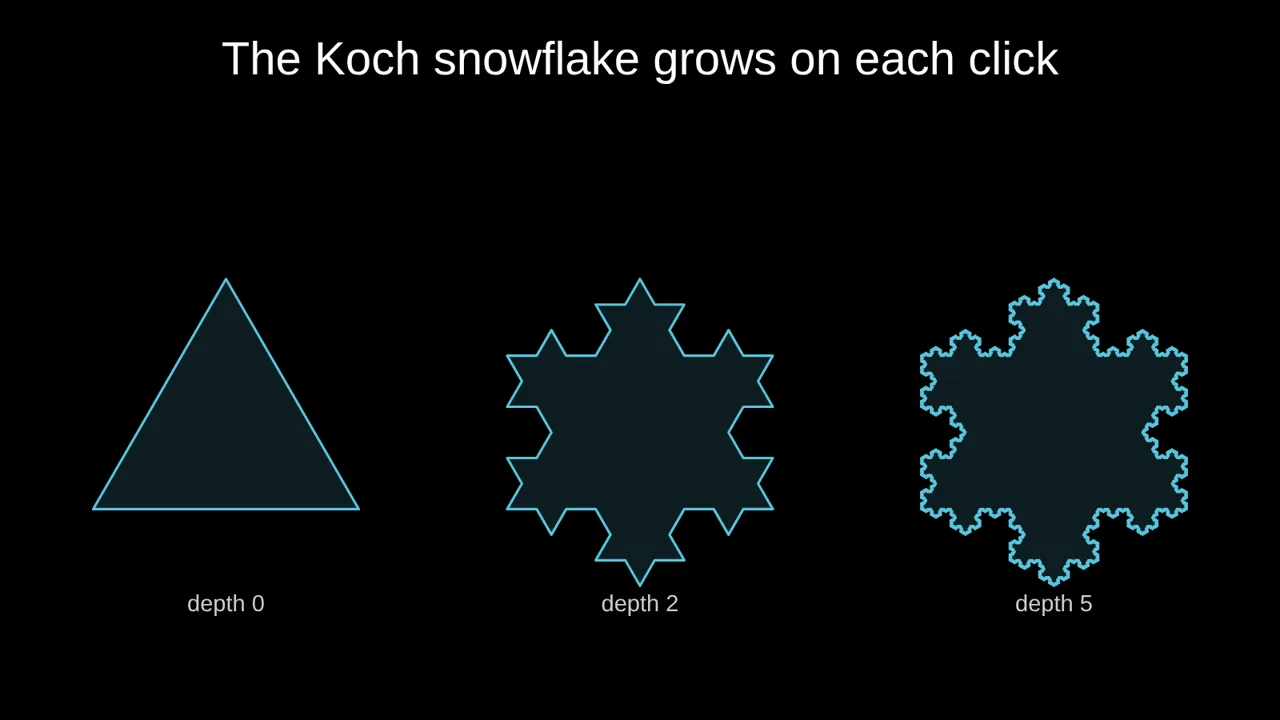
That contrast, an infinitely long boundary around a finite area, is a perfect starter for geometric series.
A dimension between 1 and 2
Zooming in on the Koch curve by a factor 3 gives 4 copies of itself, so its similarity dimension is log 4 / log 3 ≈ 1.26. The Sierpinski triangle (3 copies at half size) has dimension log 3 / log 2 ≈ 1.58. Students can compute both from the pictures.
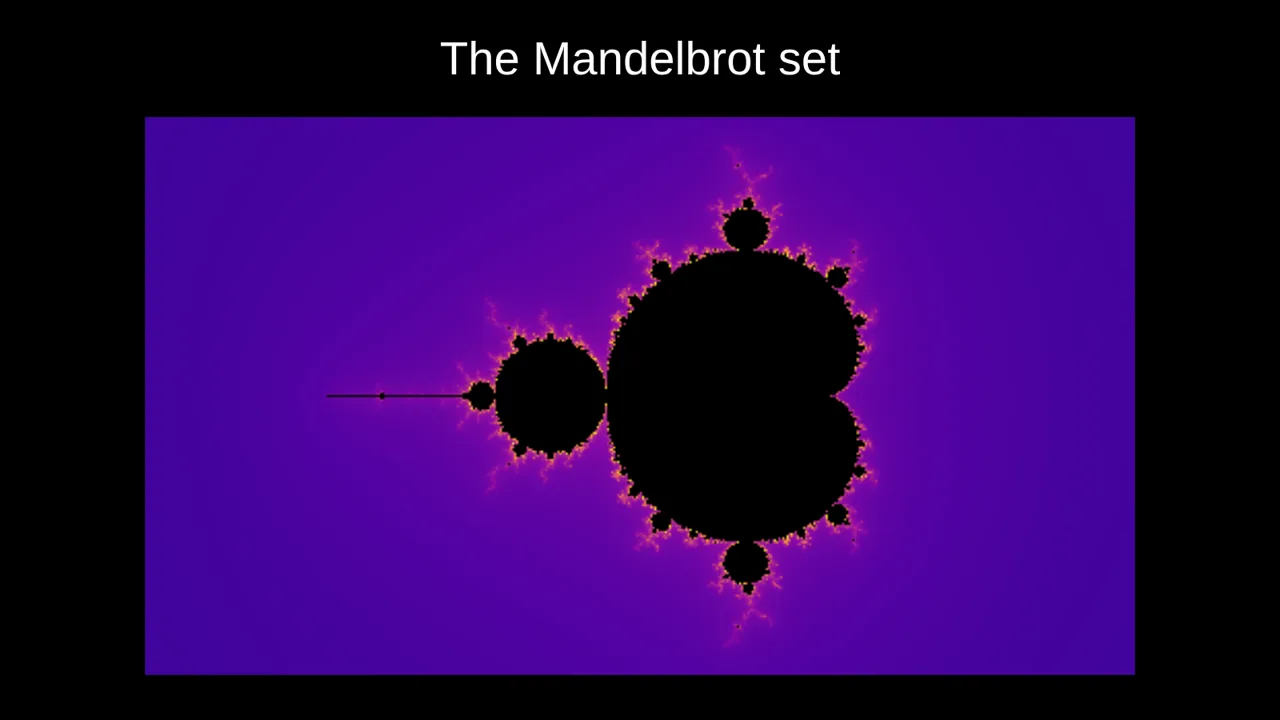
The Mandelbrot set
For each complex number c, iterate z → z² + c starting from z = 0. If z stays bounded, c is in the set (black); otherwise the colour shows how quickly it escaped. Once |z| exceeds 2 it is certain to escape, which makes the test easy to explain.
Julia sets use the same rule with c fixed and the starting point varying. Animating c makes the Julia set break apart and reassemble, a striking way to connect the two pictures.
Build them in Tracé
- Open Plot → Fractal and choose the Koch snowflake, Sierpinski triangle, fractal tree, Mandelbrot or Julia set.
- For the first three, press Reveal one level of depth per click.
- For Mandelbrot, animate Zoom between clicks; for Julia, animate the real and imaginary parts of c.
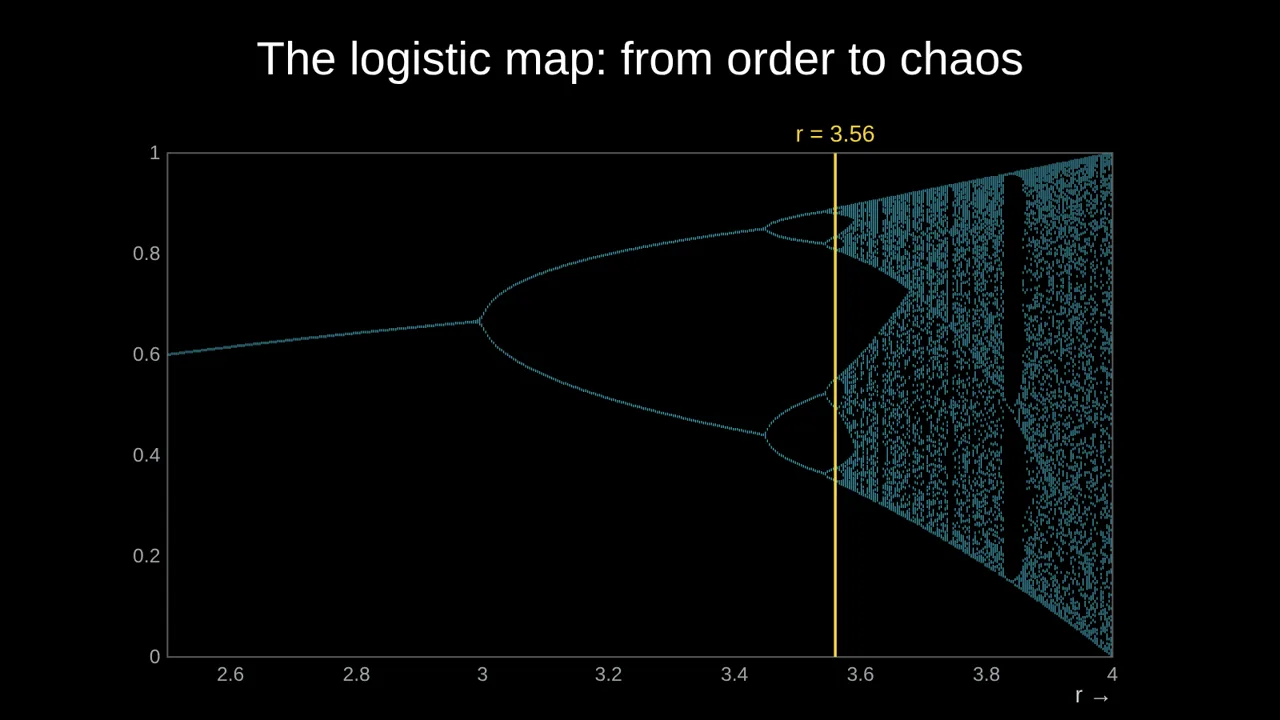
Next to them in the same menu: the logistic map, cellular automata such as rule 30 and rule 90 (which draws a Sierpinski triangle by itself), and the sieve of Eratosthenes.
Questions
How deep can the levels go?
Up to depth 8 for the line fractals; beyond that the details are smaller than a pixel on a projector.
Is the Mandelbrot picture computed live?
Yes, in the browser, from the iteration count and zoom you choose. It also exports to PDF and video.
More: Animated math slides for teachers · How to create math slides, step by step