
Topic
Explainer
9 articles on explainer: the maths or physics explained, ready-to-teach lesson plans, and how to build each slide in Tracé.
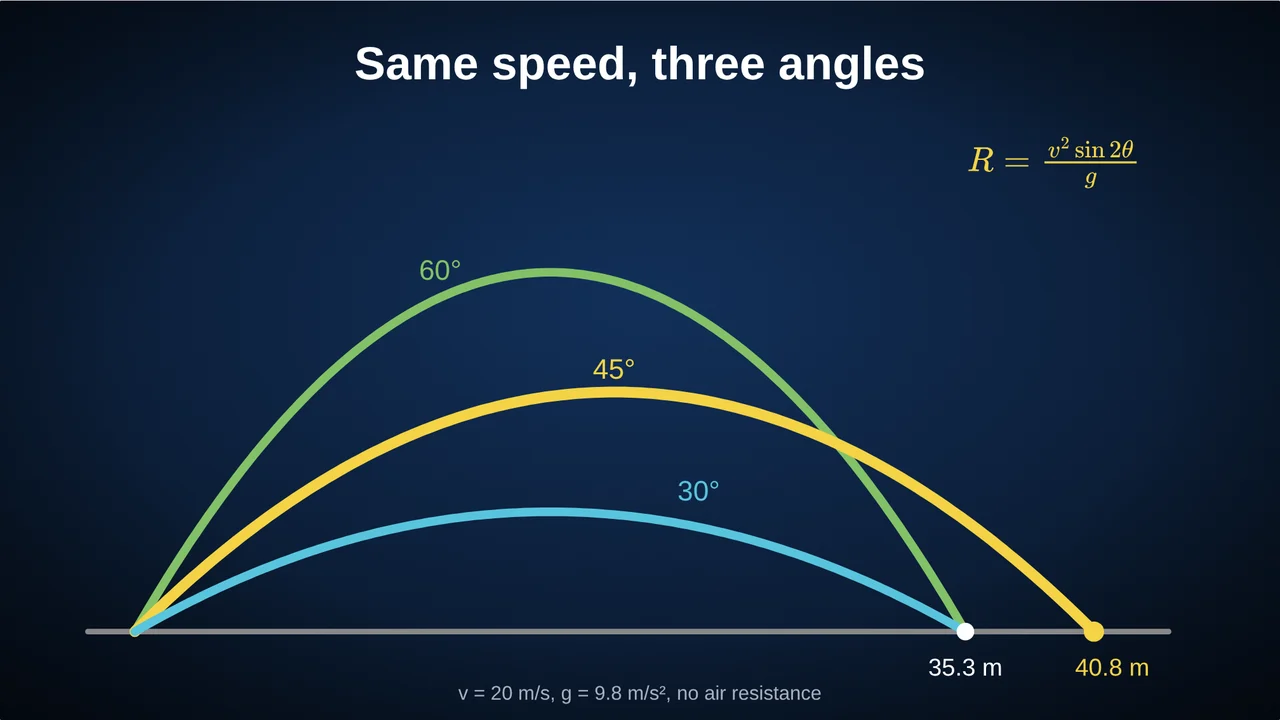 Why 45° Is the Best Launch Angle (and When It Isn’t)The proof that 45° gives the longest throw, why 30° and 60° land in the same place, and why real throws use less: launch height and air resistance.
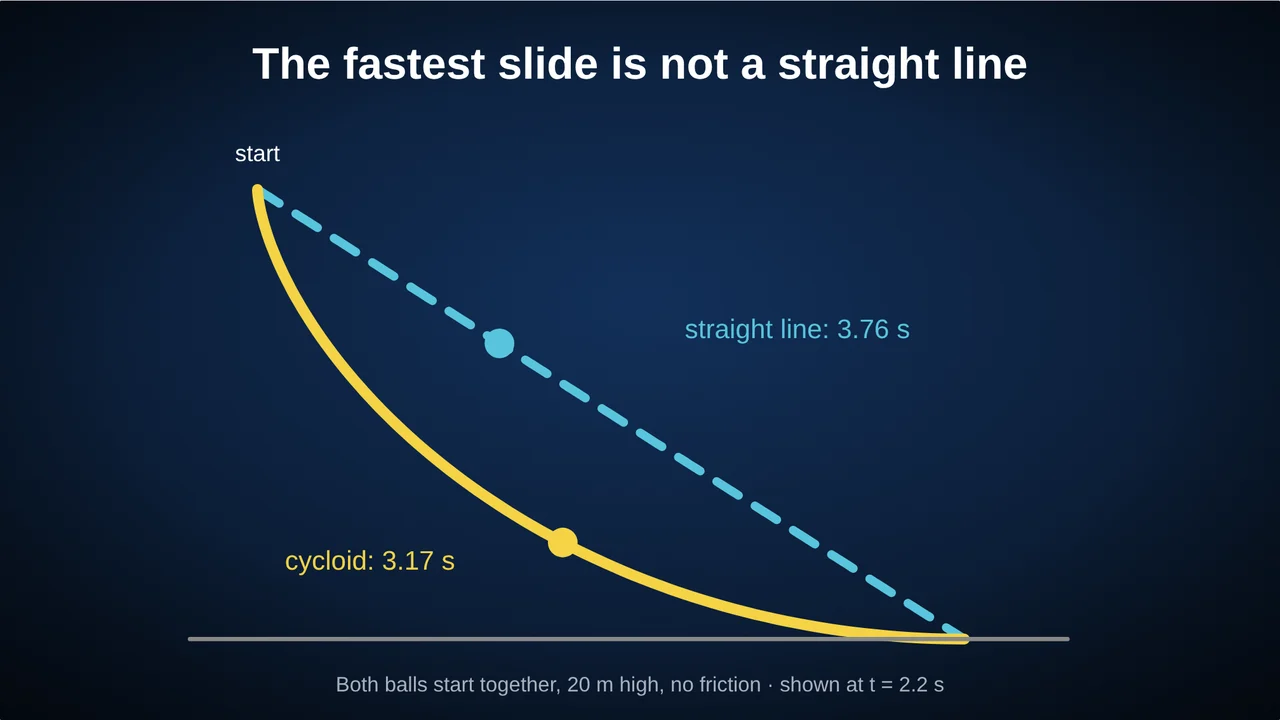 The Brachistochrone: Why the Fastest Path Is a CurveWhy a ball on a cycloid beats one on a straight ramp (3.17 s against 3.76 s for a 20 m drop), the 1696 challenge behind it, and how to animate the race.
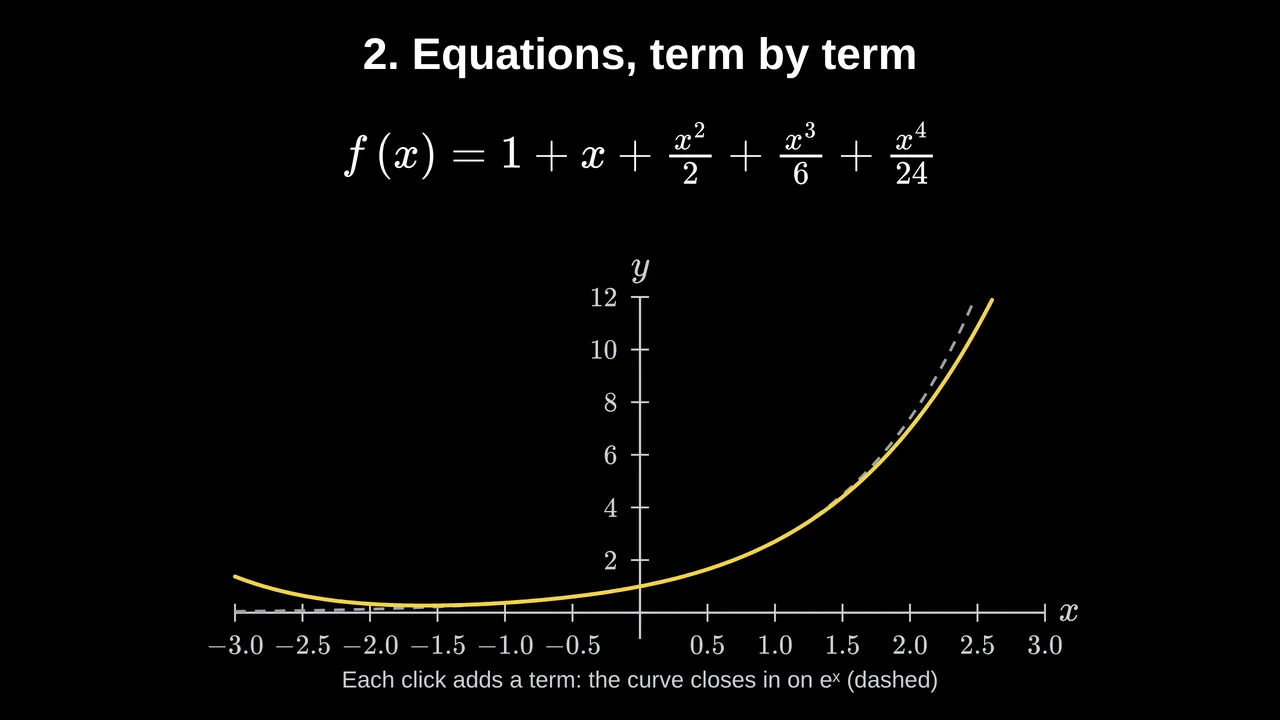 Taylor Series: Approximating Functions with PolynomialsHow Taylor series build eˣ and sin x from polynomials term by term, how accurate a few terms are, the small-angle approximation, and a click-by-click slide.
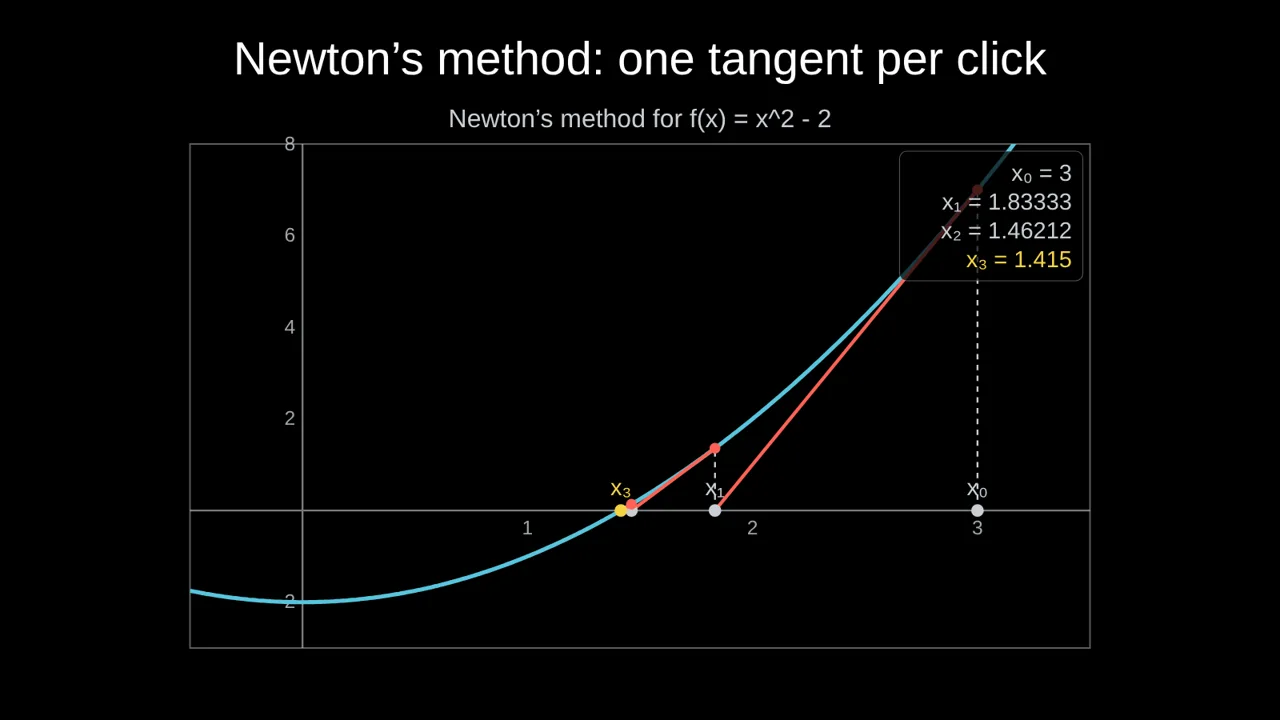 Newton's Method, Animated: One Tangent per ClickTeach Newton's method visually: follow each tangent down to the x-axis, compare it with bisection, and see why it converges so fast, or fails.
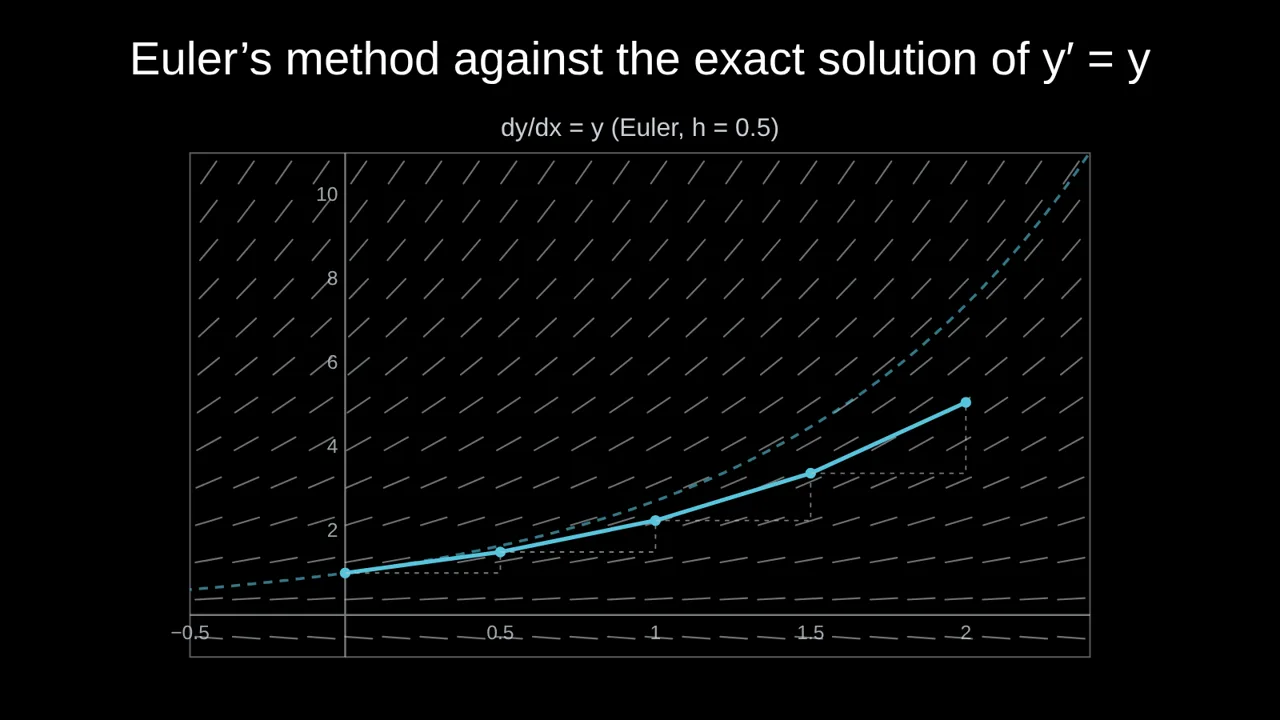 Euler's Method and Direction Fields, VisuallyA visual lesson on differential equations: draw the direction field, follow solution curves, then watch Euler’s method step away from the exact solution.
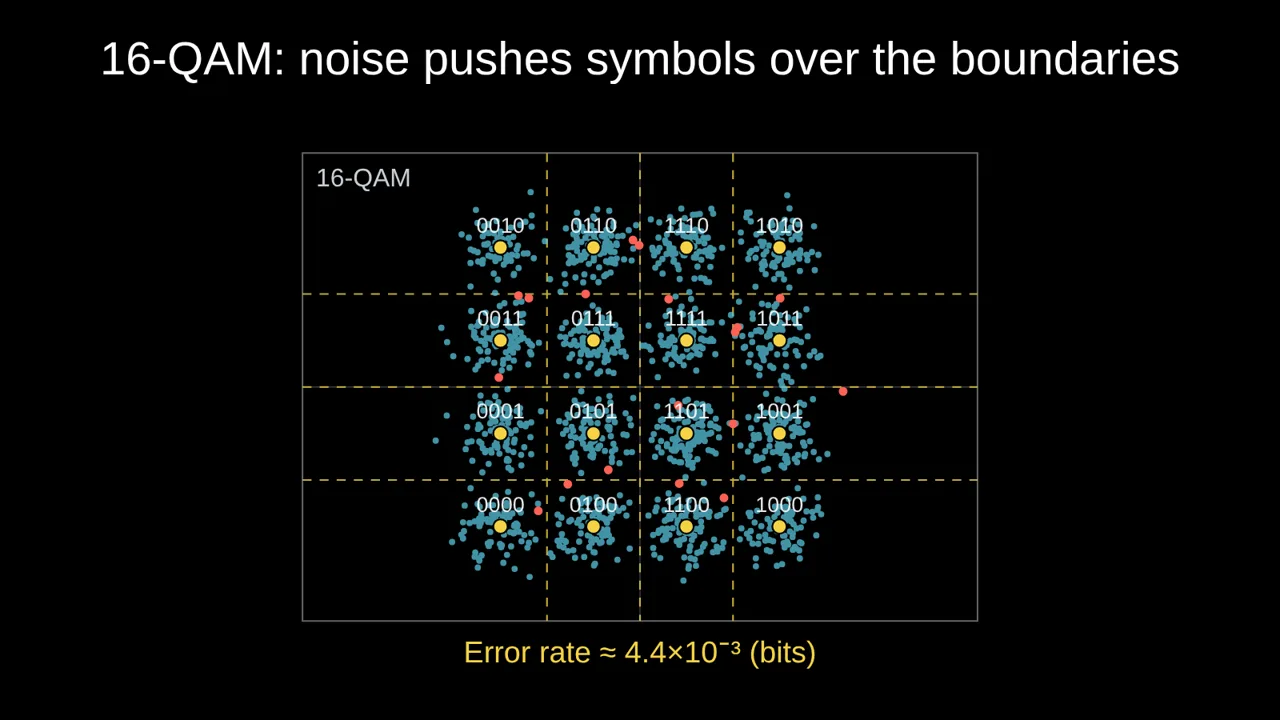 QAM Constellation Diagrams, Explained (BPSK to 256-QAM)What a constellation diagram shows, why 256-QAM needs a cleaner channel than QPSK, Gray coding, noise and phase errors, with animated examples.
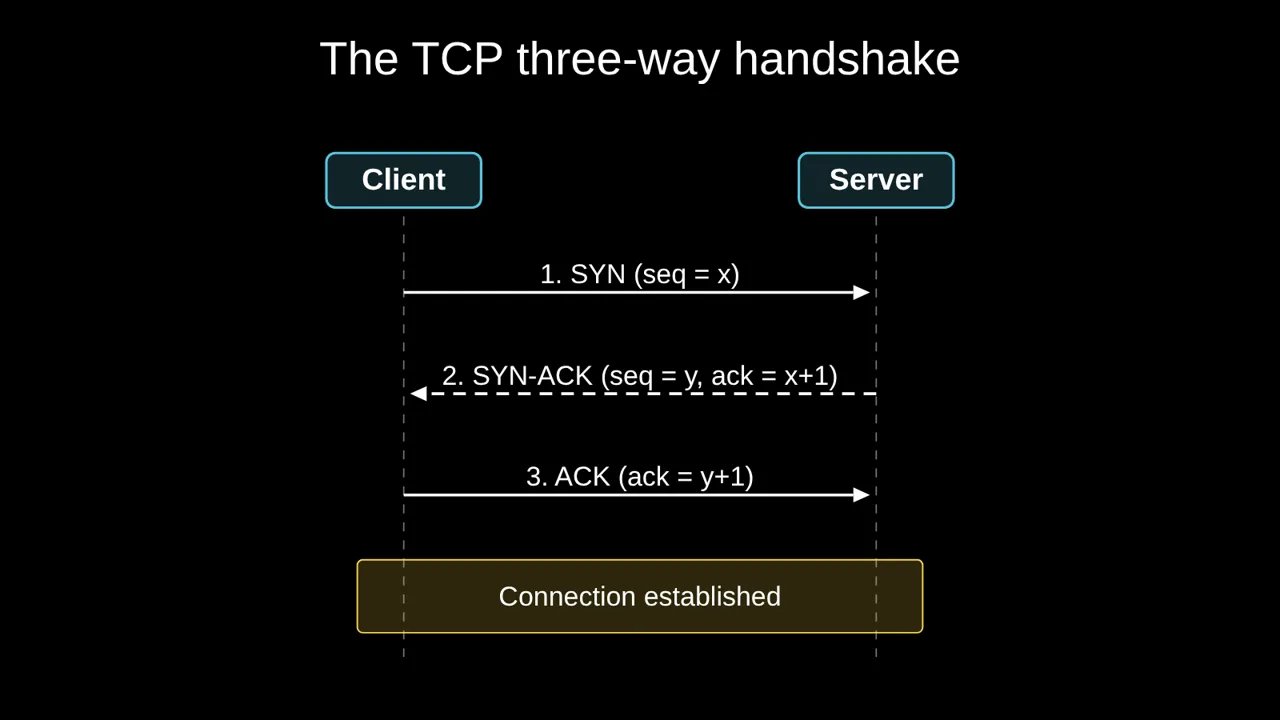 How to Explain the TCP Three-Way HandshakeTeach the TCP handshake with a sequence diagram that plays one message per click: SYN, SYN-ACK, ACK, sequence numbers, and what happens when a packet is lost.
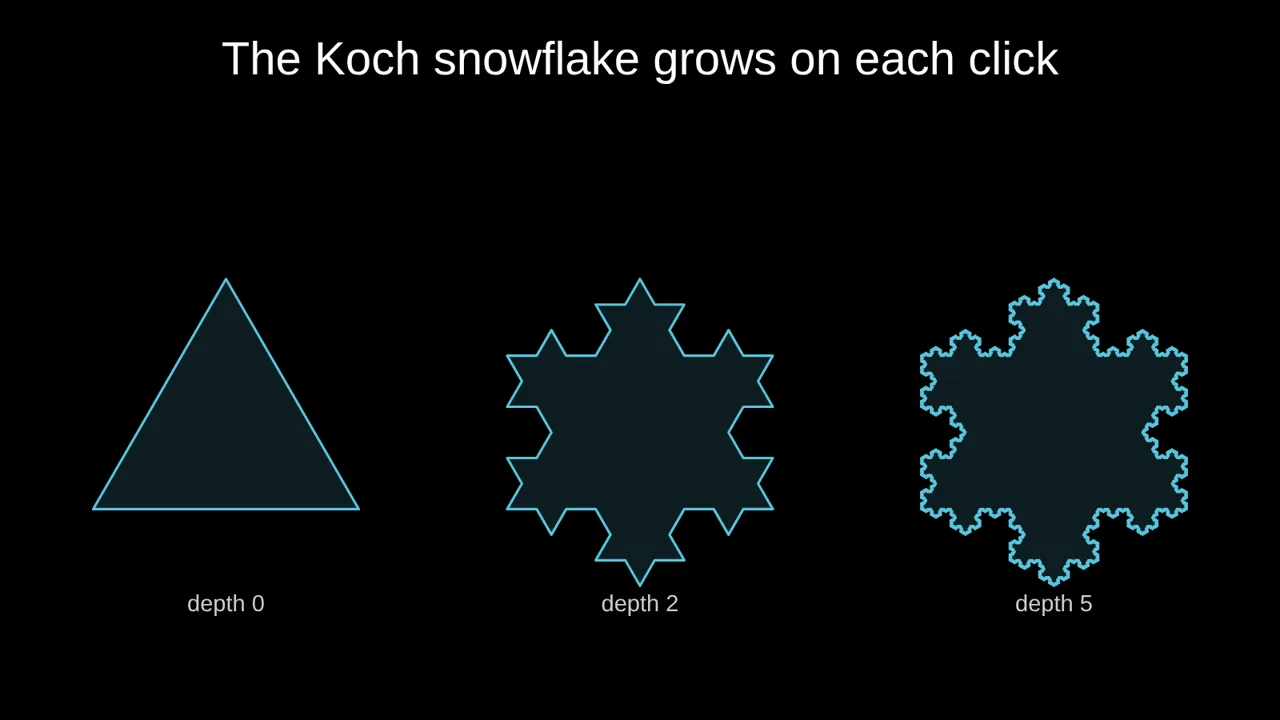 Fractals in the Classroom: Koch, Sierpinski, MandelbrotThree fractals that hook a class: the Koch snowflake step by step, the Sierpinski triangle and the Mandelbrot set, with the maths behind each.
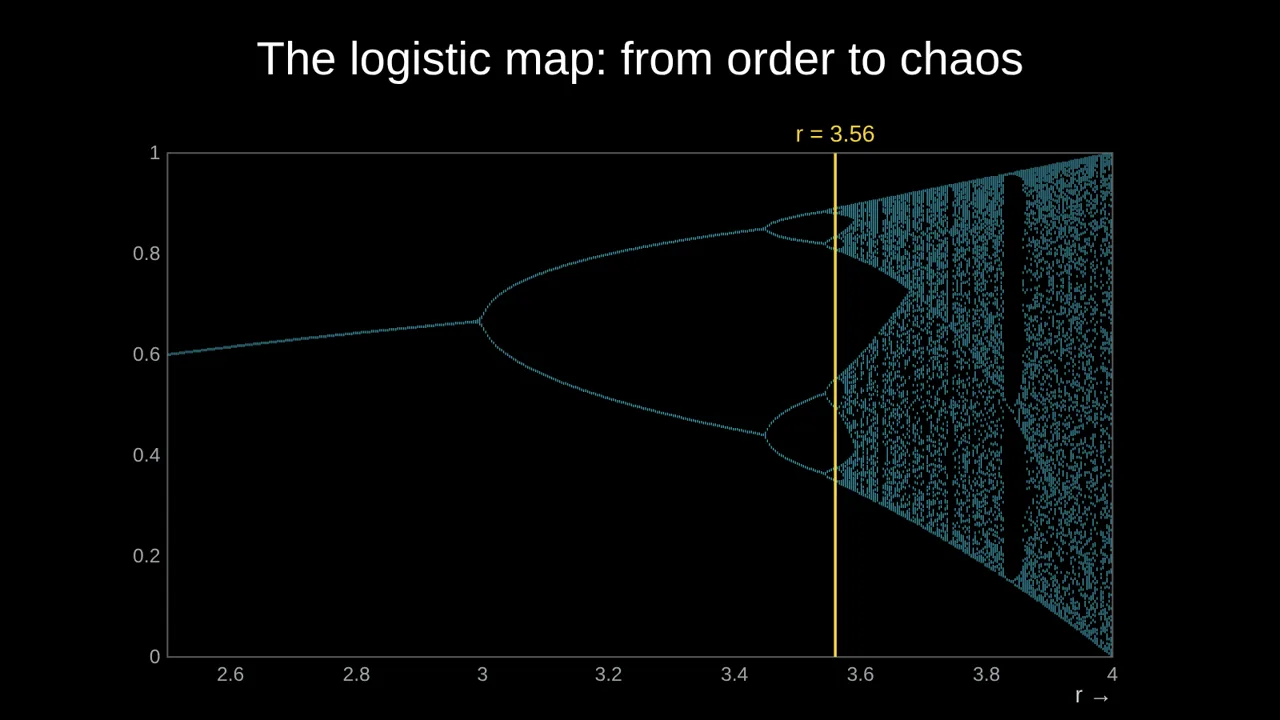 The Logistic Map: Teaching the Road to ChaosOne simple rule, x → r x (1 − x), goes from a steady state to cycles to chaos as r grows. Cobweb diagrams and the bifurcation diagram, explained.