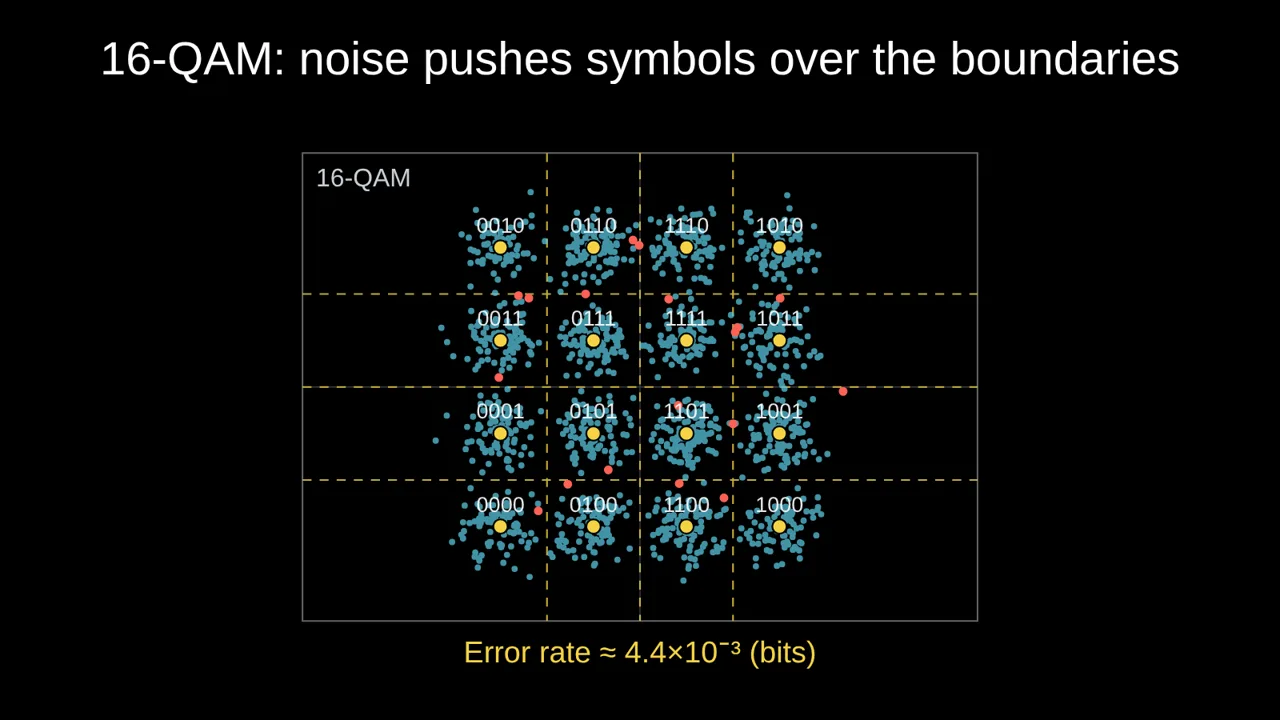
A constellation diagram plots each received symbol as a point: the in-phase component across, the quadrature component up. The ideal points are where the transmitter aimed; noise scatters what arrives around them. Every error is a point that lands closer to the wrong ideal point.
More points, more bits, less room
A modulation with M points carries log₂ M bits per symbol: BPSK 1, QPSK 2, 8-PSK 3, 16-QAM 4, 64-QAM 6, 256-QAM 8. With the same average energy per symbol, more points means they sit closer together, so the same noise causes more mistakes. That is why Wi-Fi and 5G switch to 256-QAM only when the signal is strong, and fall back to QPSK at the edge of coverage.
A common rule of thumb for a bit error rate of 10⁻⁵ (uncoded, Gray-coded): QPSK needs about 9.6 dB of Eb/N0, 16-QAM about 13.4 dB, and 64-QAM about 17.8 dB.
Gray coding
Neighbouring points are labelled so that they differ in a single bit. When noise pushes a symbol over one boundary, which is the usual error, only one bit is wrong instead of several. Showing the labels on the diagram makes this obvious: walk along a row and only one bit flips each time.
Noise is not the only problem
- Phase error: if the receiver's carrier is off by a few degrees, the whole constellation rotates. Outer points move the most, so 64- and 256-QAM suffer first. Animate the phase error on clicks and the class watches the outer corners cross their boundaries while the inner points survive.
- Jamming: a noise jammer adds to the thermal noise; a tone jammer pushes symbols around a circle instead.
Beyond the textbook shapes
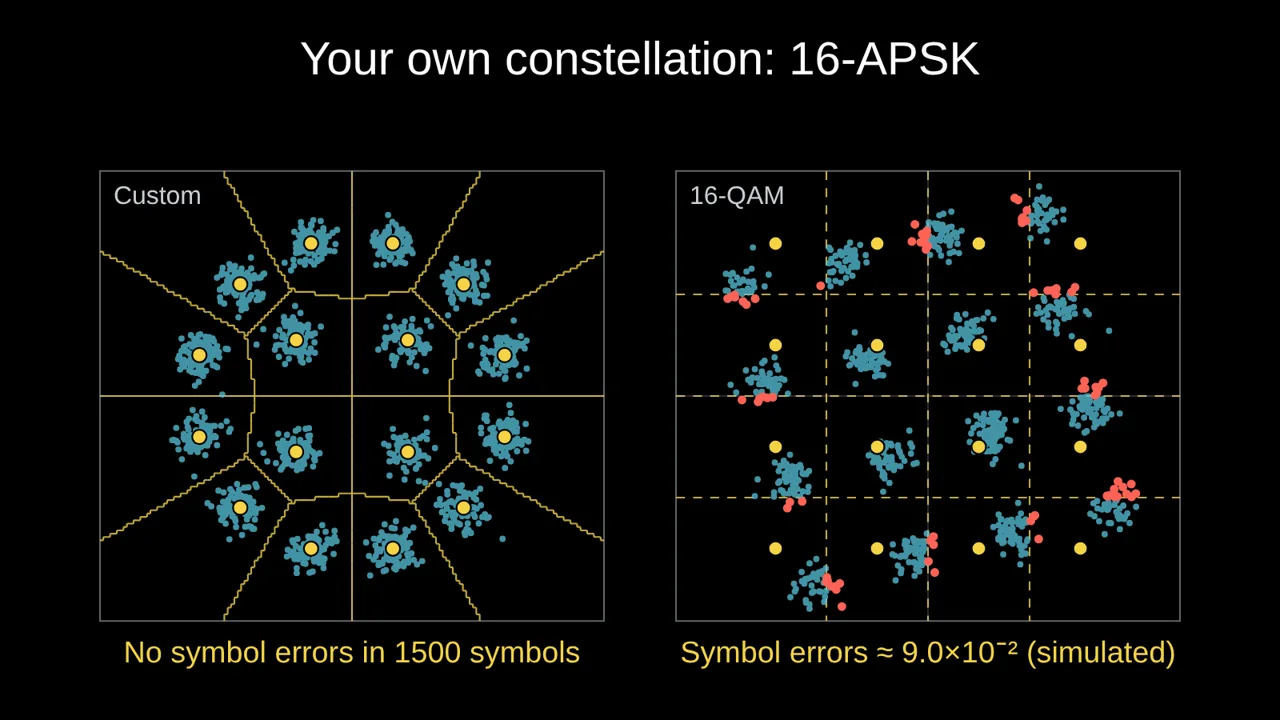
Satellite standards such as DVB-S2 use APSK: rings of points rather than a square grid, which copes better with amplifiers that compress the outer ring. Any constellation can be drawn from its points:
repeat 4: 0.5*cos(pi/4+pi*i/2), 0.5*sin(pi/4+pi*i/2)
repeat 12: cos(pi/12+pi*i/6), sin(pi/12+pi*i/6)
Build it in Tracé
- Open Science → Constellation in noise.
- Choose the Modulation: BPSK to 256-QAM, or Your own points.
- Set Eb/N0, and animate it, the jammer's J/S or the Phase error on clicks.
- Tick Show the labels (bits) for Gray coding and Show the error rate for the theoretical bit error rate.
Questions
Is the error rate simulated or theoretical?
For the standard modulations with noise, it is the textbook bit error rate for Gray coding. With a tone jammer, a phase error or your own points, Tracé counts the symbol errors in the simulated points.
Why is the average energy normalised to 1?
So that different modulations are compared fairly: at the same Eb/N0, you see the cost of packing more bits into each symbol.
More: Animated math slides for teachers · How to create math slides, step by step