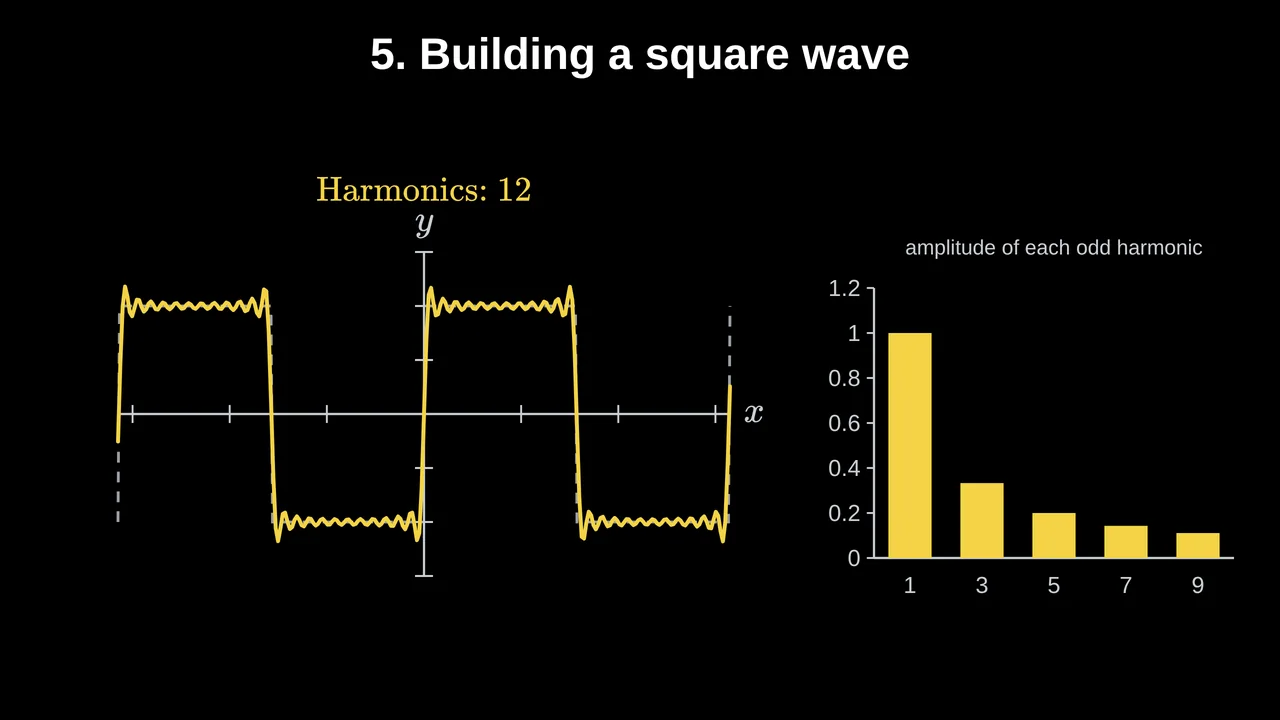
A square wave, which jumps between −1 and +1, is a sum of smooth sine waves. Add sin x, then sin 3x / 3, then sin 5x / 5, and so on: each new term sharpens the corners. The full series is (4/π)(sin x + sin 3x/3 + sin 5x/5 + …).
The series
For the square wave that equals +1 between 0 and π and −1 between π and 2π:
f(x) = (4/π) [ sin x + sin(3x)/3 + sin(5x)/5 + sin(7x)/7 + … ]Each term is a harmonic: a sine wave whose frequency is a whole multiple of the first. The nth harmonic has amplitude 4/(nπ), so the high ones matter less and less, but they are what make the corners sharp.
Why only odd harmonics
The square wave has a symmetry: its second half is its first half turned upside down. Even harmonics (sin 2x, sin 4x…) do not have that symmetry, so their contributions cancel out and their coefficients are zero. Only the odd ones remain.
A good question to ask before showing the formula: which sine waves do you think a square wave needs? Students usually expect all of them.
The 9% overshoot that never goes away
Near each jump, the sum overshoots: it rises above 1 before settling. Adding more terms makes the ripple narrower and pushes it closer to the jump, but its height does not shrink. It stays at about 9% of the jump, so the peak sits near 1.18 instead of 1.
This is the Gibbs phenomenon. It happens whenever a Fourier series meets a jump, and it is why a sharp edge in an image or a sound can come out with a faint ringing next to it.
Where it is used
- Sound: a square wave from a synthesiser sounds hollow and buzzy because of its strong odd harmonics.
- Electronics: a digital clock signal is close to a square wave, and its harmonics are what can interfere with nearby radio.
- Signals and images: compression formats keep the strongest frequency components and drop the weak ones.
Building it click by click in Tracé
- Add a graph with
y = sin(x)and let it draw itself. - Add a click and change the equation to
y = sin(x) + sin(3x)/3: the curve morphs to its new shape. Repeat withsin(5x)/5, thensin(7x)/7. - For the full picture, the Signal and spectrum object takes the components directly, for example
1: 1, 3: 0.333, 5: 0.2, 7: 0.143, and shows the wave next to its spectrum. - For a more playful version, the Fourier drawing object traces any shape with turning circles.
Questions
Why is there a 4/π in front?
It scales the sum so the wave sits at ±1. Without it, the flat parts would be at about ±0.785.
Does the series ever equal the square wave exactly?
At every point except the jumps, the sum gets as close as you like as you add terms. At the jumps themselves it gives 0, the midpoint, and the Gibbs ripple never disappears from its neighbourhood.
What about a triangle wave?
It also uses only odd harmonics, but their amplitudes fall as 1/n², much faster. That is why a triangle wave looks and sounds much smoother.
More: Physics animations for the classroom · How to create math slides, step by step