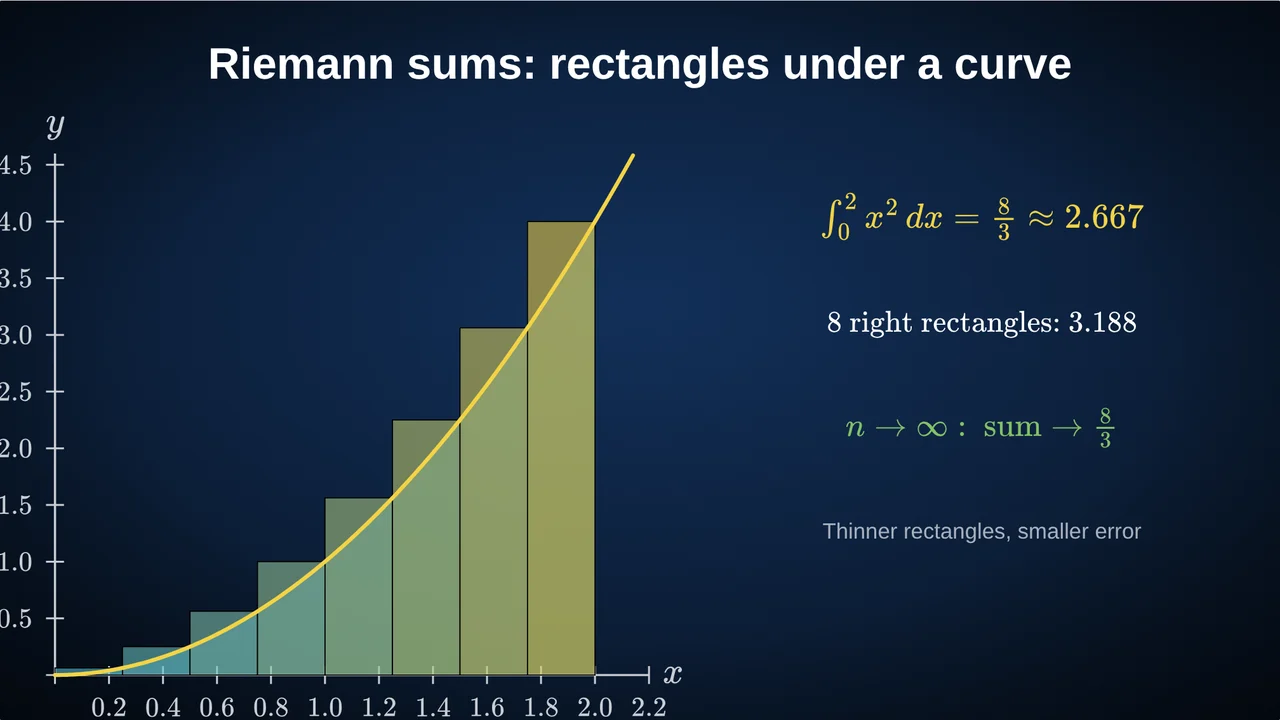
A Riemann sum estimates the area under a curve by filling it with rectangles and adding their areas. With more, thinner rectangles the estimate gets closer to the exact area, the integral. Under y = x² from 0 to 2, eight right rectangles give 3.188, against the exact 8/3 ≈ 2.667.
Learning objectives
- Compute left, right and midpoint Riemann sums.
- Explain why an increasing function makes the right sum too big and the left sum too small.
- See the integral as the limit of Riemann sums as the rectangles get thinner.
The opening question
"How would you measure the area of a lake on a map, when its edge is curved?" Students suggest a grid of squares. Rectangles under a curve are the same idea, with the edge made of one function.
The lesson, click by click
- Click 0: y = x² from 0 to 2, area shaded.
- Click 1: 4 right rectangles, width 0.5: 0.5 × (0.25 + 1 + 2.25 + 4) = 3.75.
- Click 2: 8 right rectangles, width 0.25: 3.188. Then 8 left rectangles: 2.188.
- Click 3: 8 midpoint rectangles: 2.656, already within 0.011 of the exact area.
- Click 4: 40 rectangles: the staircase almost disappears. The limit is the integral, 8/3.
| 8 rectangles under x² on [0, 2] | Sum | Error |
|---|---|---|
| Left endpoints | 2.188 | −0.479 |
| Right endpoints | 3.188 | +0.521 |
| Midpoints | 2.656 | −0.010 |
Common mistakes to watch for
- Forgetting the width. The sum is width × (sum of heights), not just the heights.
- Wrong endpoints. Right endpoints for 8 rectangles on [0, 2] are 0.25, 0.5, …, 2, not 0 to 1.75.
- Assuming right is always an overestimate. Only for increasing functions; for a decreasing one, it underestimates.
- Negative areas. Below the x-axis, the rectangles count negatively.
Check questions
- Right sum for y = x on [0, 2] with 2 rectangles? (1 × (1 + 2) = 3; exact area 2.)
- Is the left sum of y = x² on [0, 2] too big or too small? (Too small: the function increases.)
- What happens to the error when the number of rectangles doubles? (For left and right sums it roughly halves.)
Building it in Tracé
- Plot
y = x^2from 0 to 2.2, and tick Shade the area under the curve from 0 to 2. - Set Riemann rectangles (0 = none) to 4 and choose Rectangle height taken at: left edge, middle or right edge.
- Add clicks that raise the number of rectangles to 8, then 40: they split smoothly as you present.
Questions
Why is the midpoint rule so accurate?
On each rectangle, the bit it overshoots on one side roughly cancels the bit it misses on the other. Its error shrinks with the square of the width, much faster than for left or right sums.
When are Riemann sums taught?
At the start of integration, usually in the last year of high school (AP Calculus, A-level, terminale).
What is the trapezoidal rule?
The average of the left and right sums, which replaces each rectangle with a trapezoid. Here it gives 2.688.
More: Animated math slides for teachers · How to create math slides, step by step