The slope of a line is how much it goes up for each step to the right: rise over run. In y = mx + b, m is that slope and b is where the line crosses the y-axis. Moving m and b with sliders in front of the class makes both meanings obvious in a few seconds.
Learning objectives
- Find the slope from a graph and from two points.
- Say what m and b change in the graph of y = mx + b.
- Write the equation of a line through two points.
The opening question
Show two ramps, one twice as steep as the other, and ask: how would you describe "twice as steep" with a number? Students usually suggest the angle; steer them to "how far up for each step across", which is the slope.
The lesson, click by click
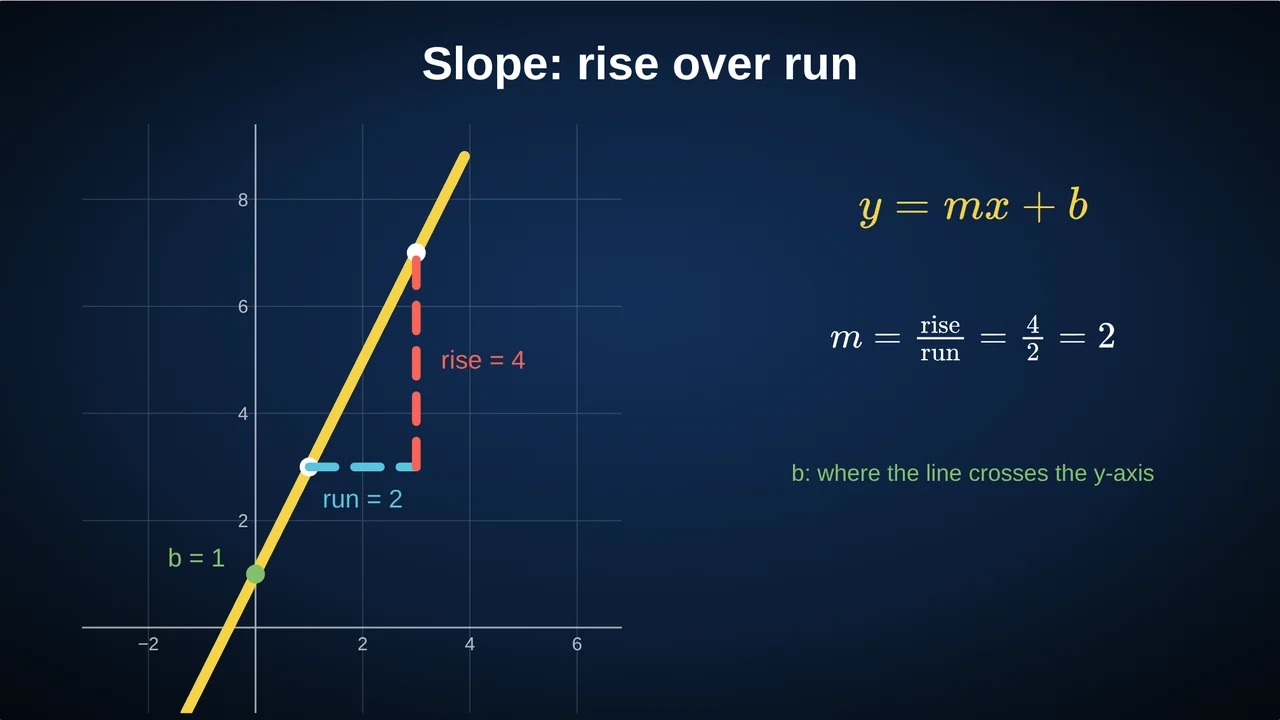
- Click 0: the line y = 2x + 1 on a grid.
- Click 1: two points on it, (1, 3) and (3, 7).
- Click 2: the run, 2 across, then the rise, 4 up.
- Click 3: m = rise / run = 4 / 2 = 2, then the formula m = (y₂ − y₁) / (x₂ − x₁).
- Live sliders: drag m from −3 to 3. The line tilts and passes through flat at m = 0. Then drag b: the line slides up and down without tilting.
Ask before each drag: what will happen to the line when m becomes negative? The prediction matters more than the answer.
Common mistakes to watch for
- Run over rise. Students divide the wrong way round. "Rise first, like climbing stairs" helps.
- Mixed-up subtraction. (y₂ − y₁) / (x₁ − x₂) flips the sign. Both differences must start from the same point.
- Vertical lines. Their slope is undefined (the run is 0), not 0. A horizontal line has slope 0.
- b as the x-intercept. b is where the line crosses the y-axis, at x = 0.
Check questions
- Find the slope through (2, 5) and (6, 13). (8 / 4 = 2.)
- Write the equation of that line. (5 = 2 × 2 + b, so b = 1: y = 2x + 1.)
- Which is steeper, y = −3x or y = 2x + 5? (−3: steepness is the size of the slope; the sign only gives the direction.)
Building it in Tracé
- Add an equation and type
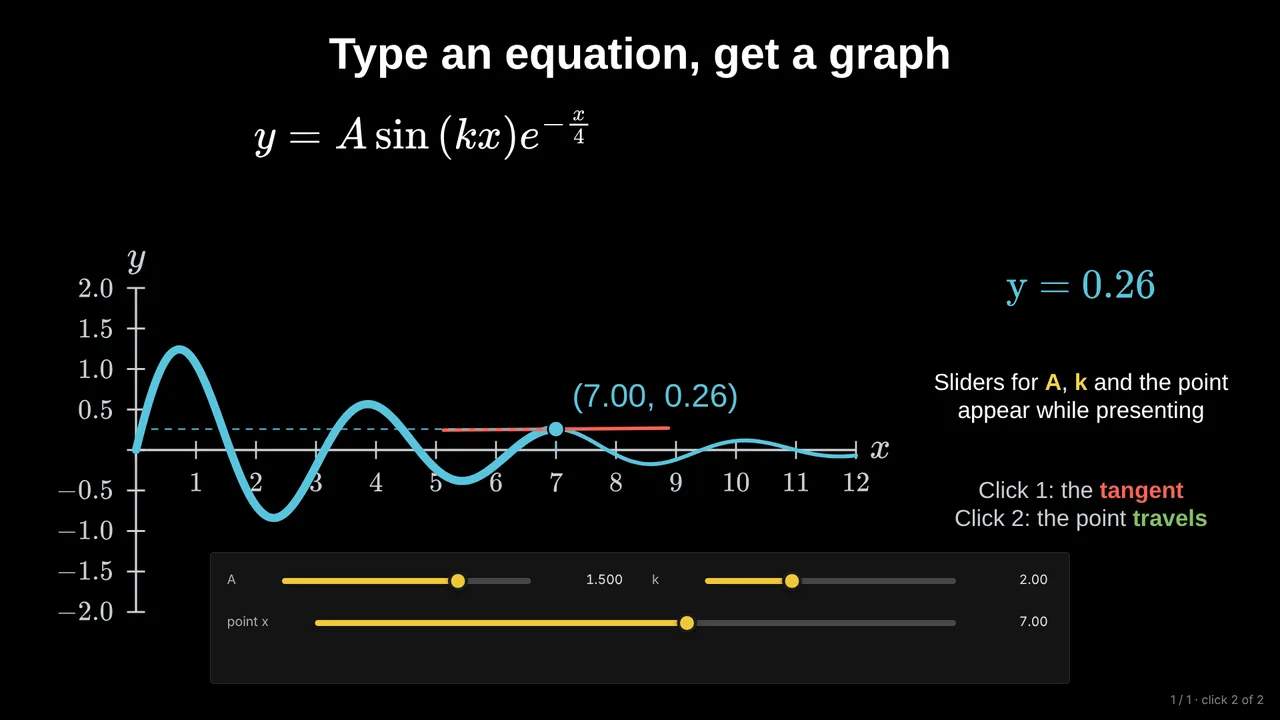
y = m x + b, then press Plot this equation as a graph. - Tick Live slider for m and for b: the sliders appear under the slide while you present.
- Add the two points and the rise and run as dashed lines, each on its own click.
- Present, and let a student drag the sliders while the class predicts.
Questions
What grade is slope taught in?
Usually around ages 13 to 15 (grades 7 to 8 in the US Common Core), and revisited in Algebra 1.
How do parallel and perpendicular lines fit in?
Parallel lines have the same slope. Perpendicular lines have slopes that multiply to −1, such as 2 and −½. Two sliders on two lines show both nicely.
Where does slope lead next?
To rates of change in real situations (speed, cost per item), and later to the derivative, which is the slope of a curve at a point.
More: Animated math slides for teachers · How to create math slides, step by step