
Topic
Graphs
6 articles on graphs: the maths or physics explained, ready-to-teach lesson plans, and how to build each slide in Tracé.
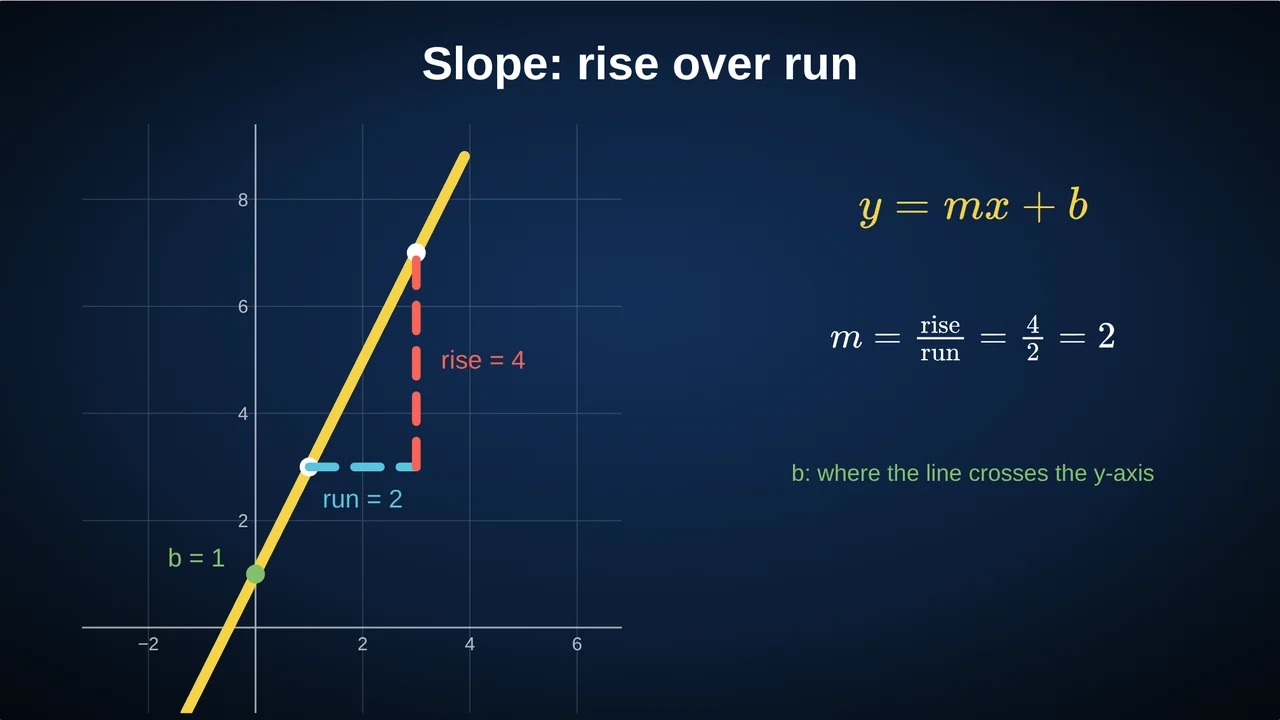 Teaching Slope and y = mx + b: An Animated Lesson PlanA slope lesson students can see: rise over run, what m and b do to a line, the usual mistakes, check questions, and live sliders for m and b.
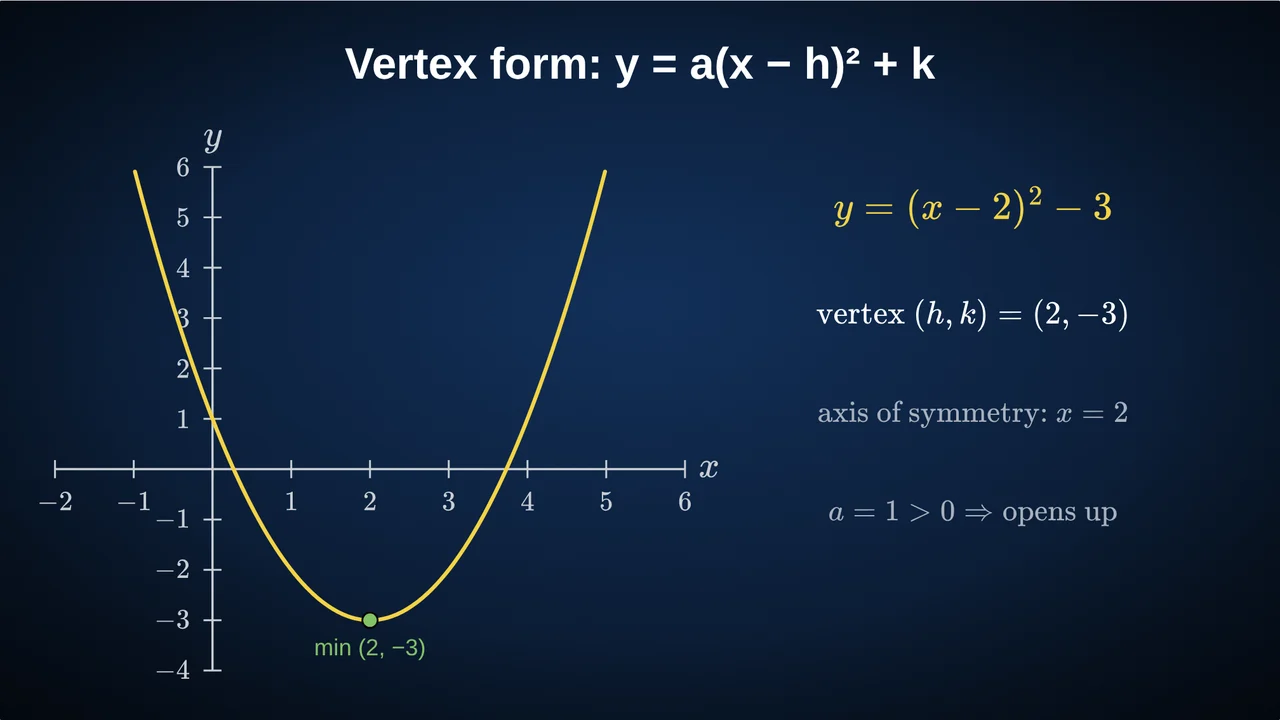 Graphing Quadratic Functions in Vertex Form: Lesson PlanTeach vertex form y = a(x − h)² + k: what a, h and k do to a parabola, completing the square, the sign trap with h, and live sliders to explore it.
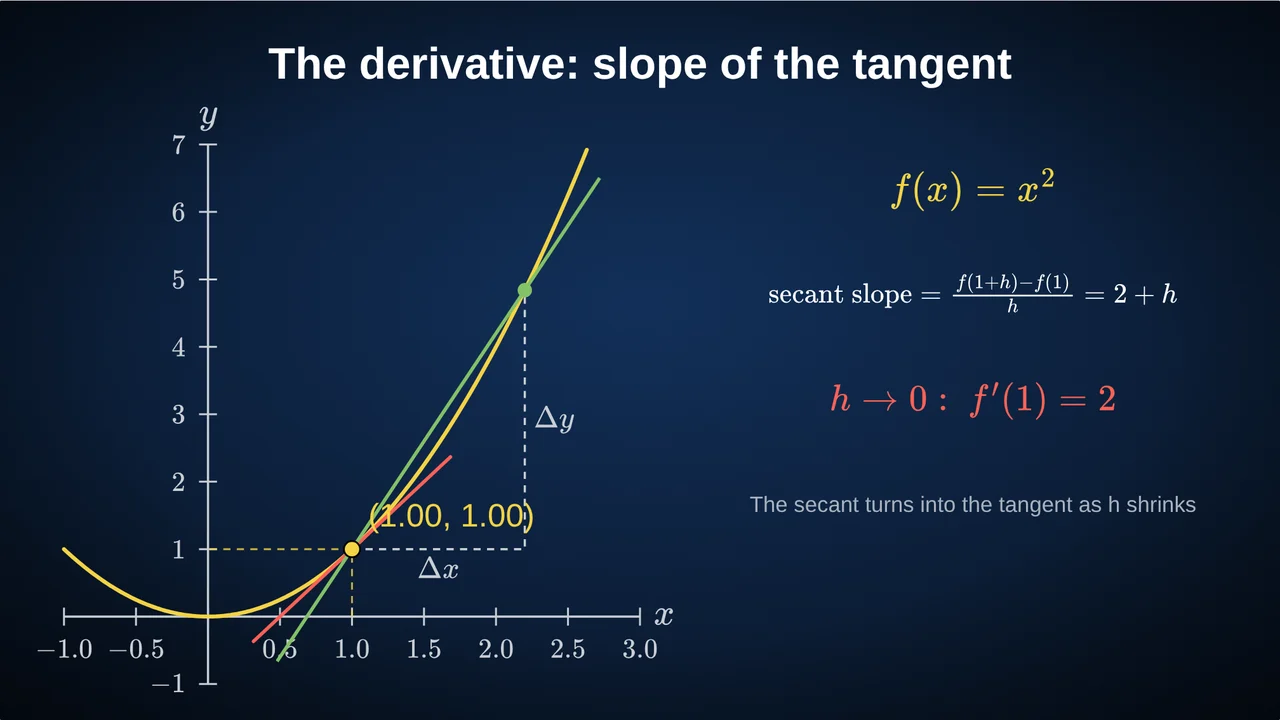 The Derivative as the Slope of a Tangent: Lesson PlanIntroduce the derivative as the slope of the tangent line: secants that shrink, the limit (f(x+h) − f(x))/h, a worked example with x², mistakes and checks.
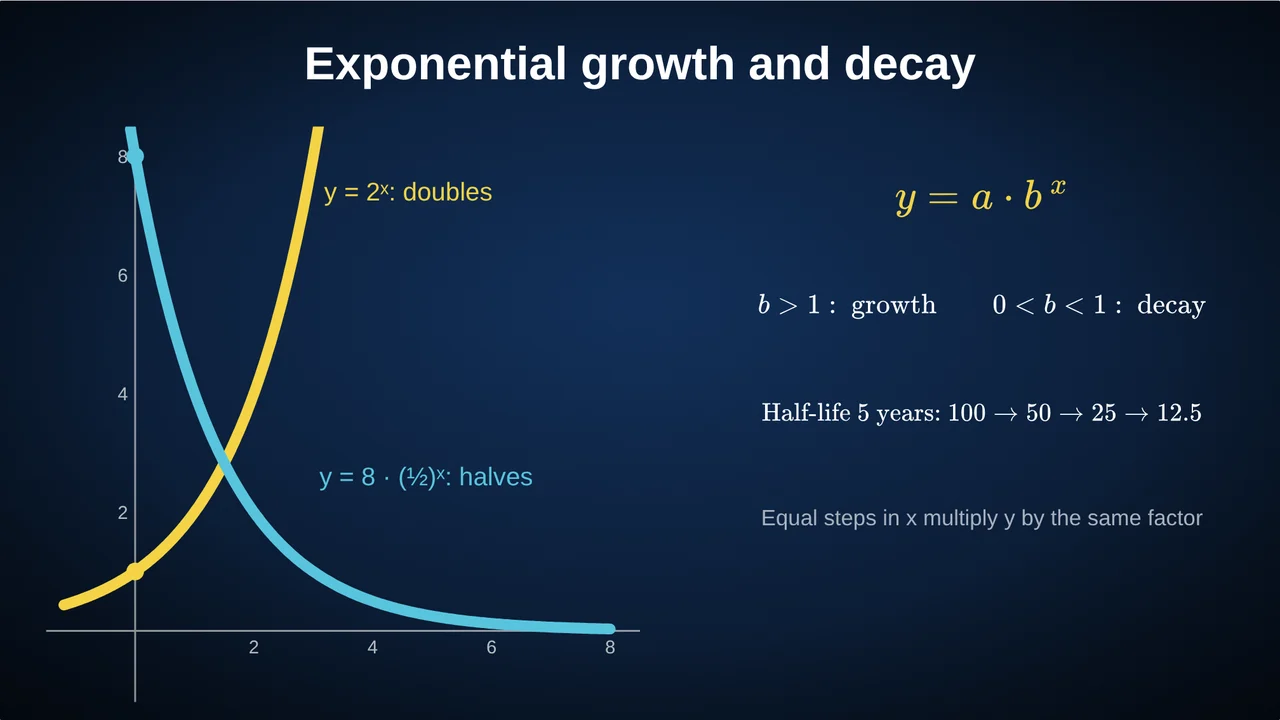 Exponential Growth and Decay: A Lesson PlanTeach exponential growth and decay with y = a·bˣ: doubling, half-life, compound interest, why exponential beats x², common mistakes and check questions.
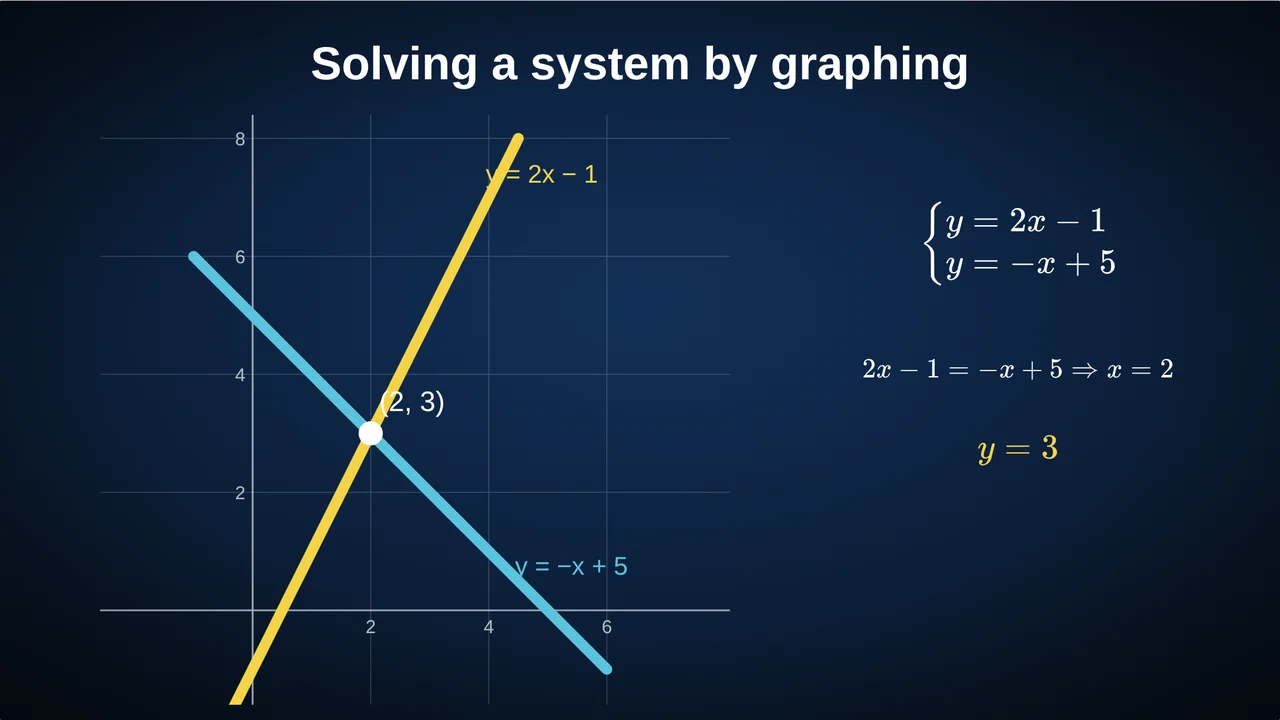 Solving Systems of Equations by Graphing: Lesson PlanTeach systems of linear equations by graphing: the intersection as the solution, one, none or infinitely many solutions, substitution as a check, and mistakes.
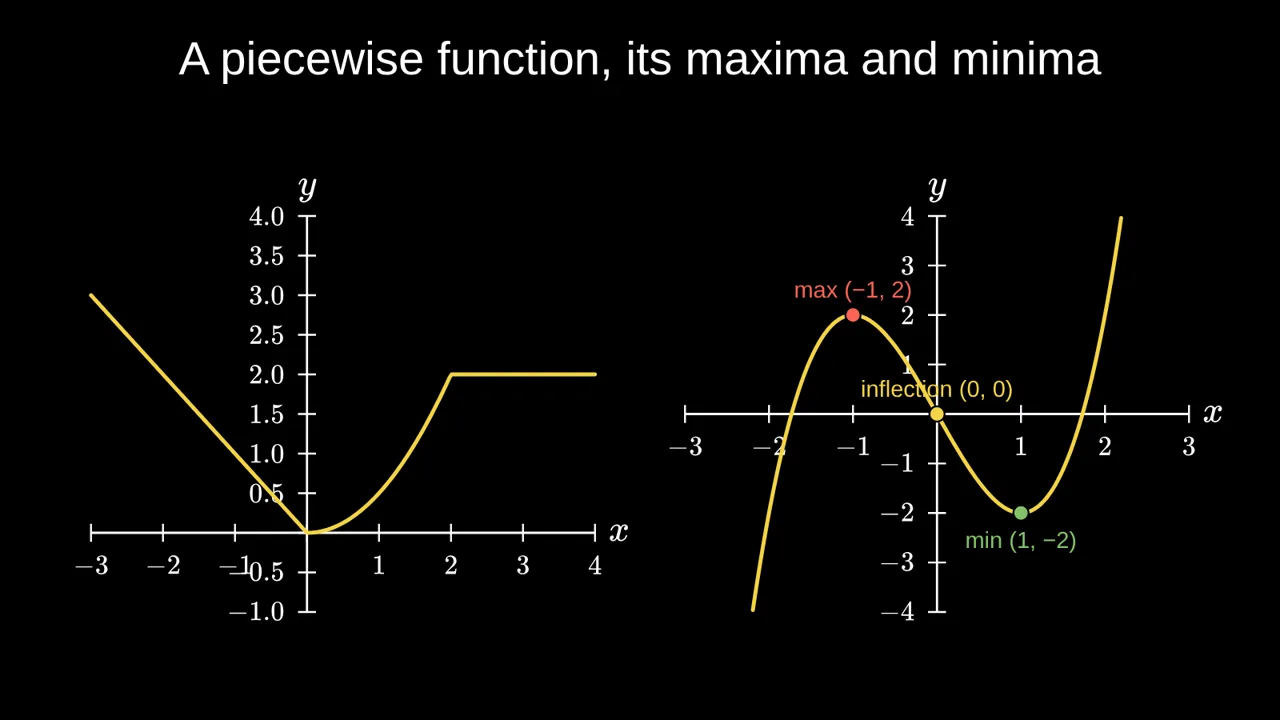 How to Animate Maths for Teaching, Without CodeA practical guide to animated maths slides: what to animate, how to reveal ideas one click at a time, and how to build it without Python or Manim.